7-figure Performance Max + Search growth, with control
$5.47M revenue on $1.12M ad spend (ROAS 4.89)
This case study shows the structure, scripts, and CRO fixes we shipped to scale a US ecommerce account without turning Performance Max into a black box.
Proof is shown via video walkthrough and on-screen Google Ads reporting.
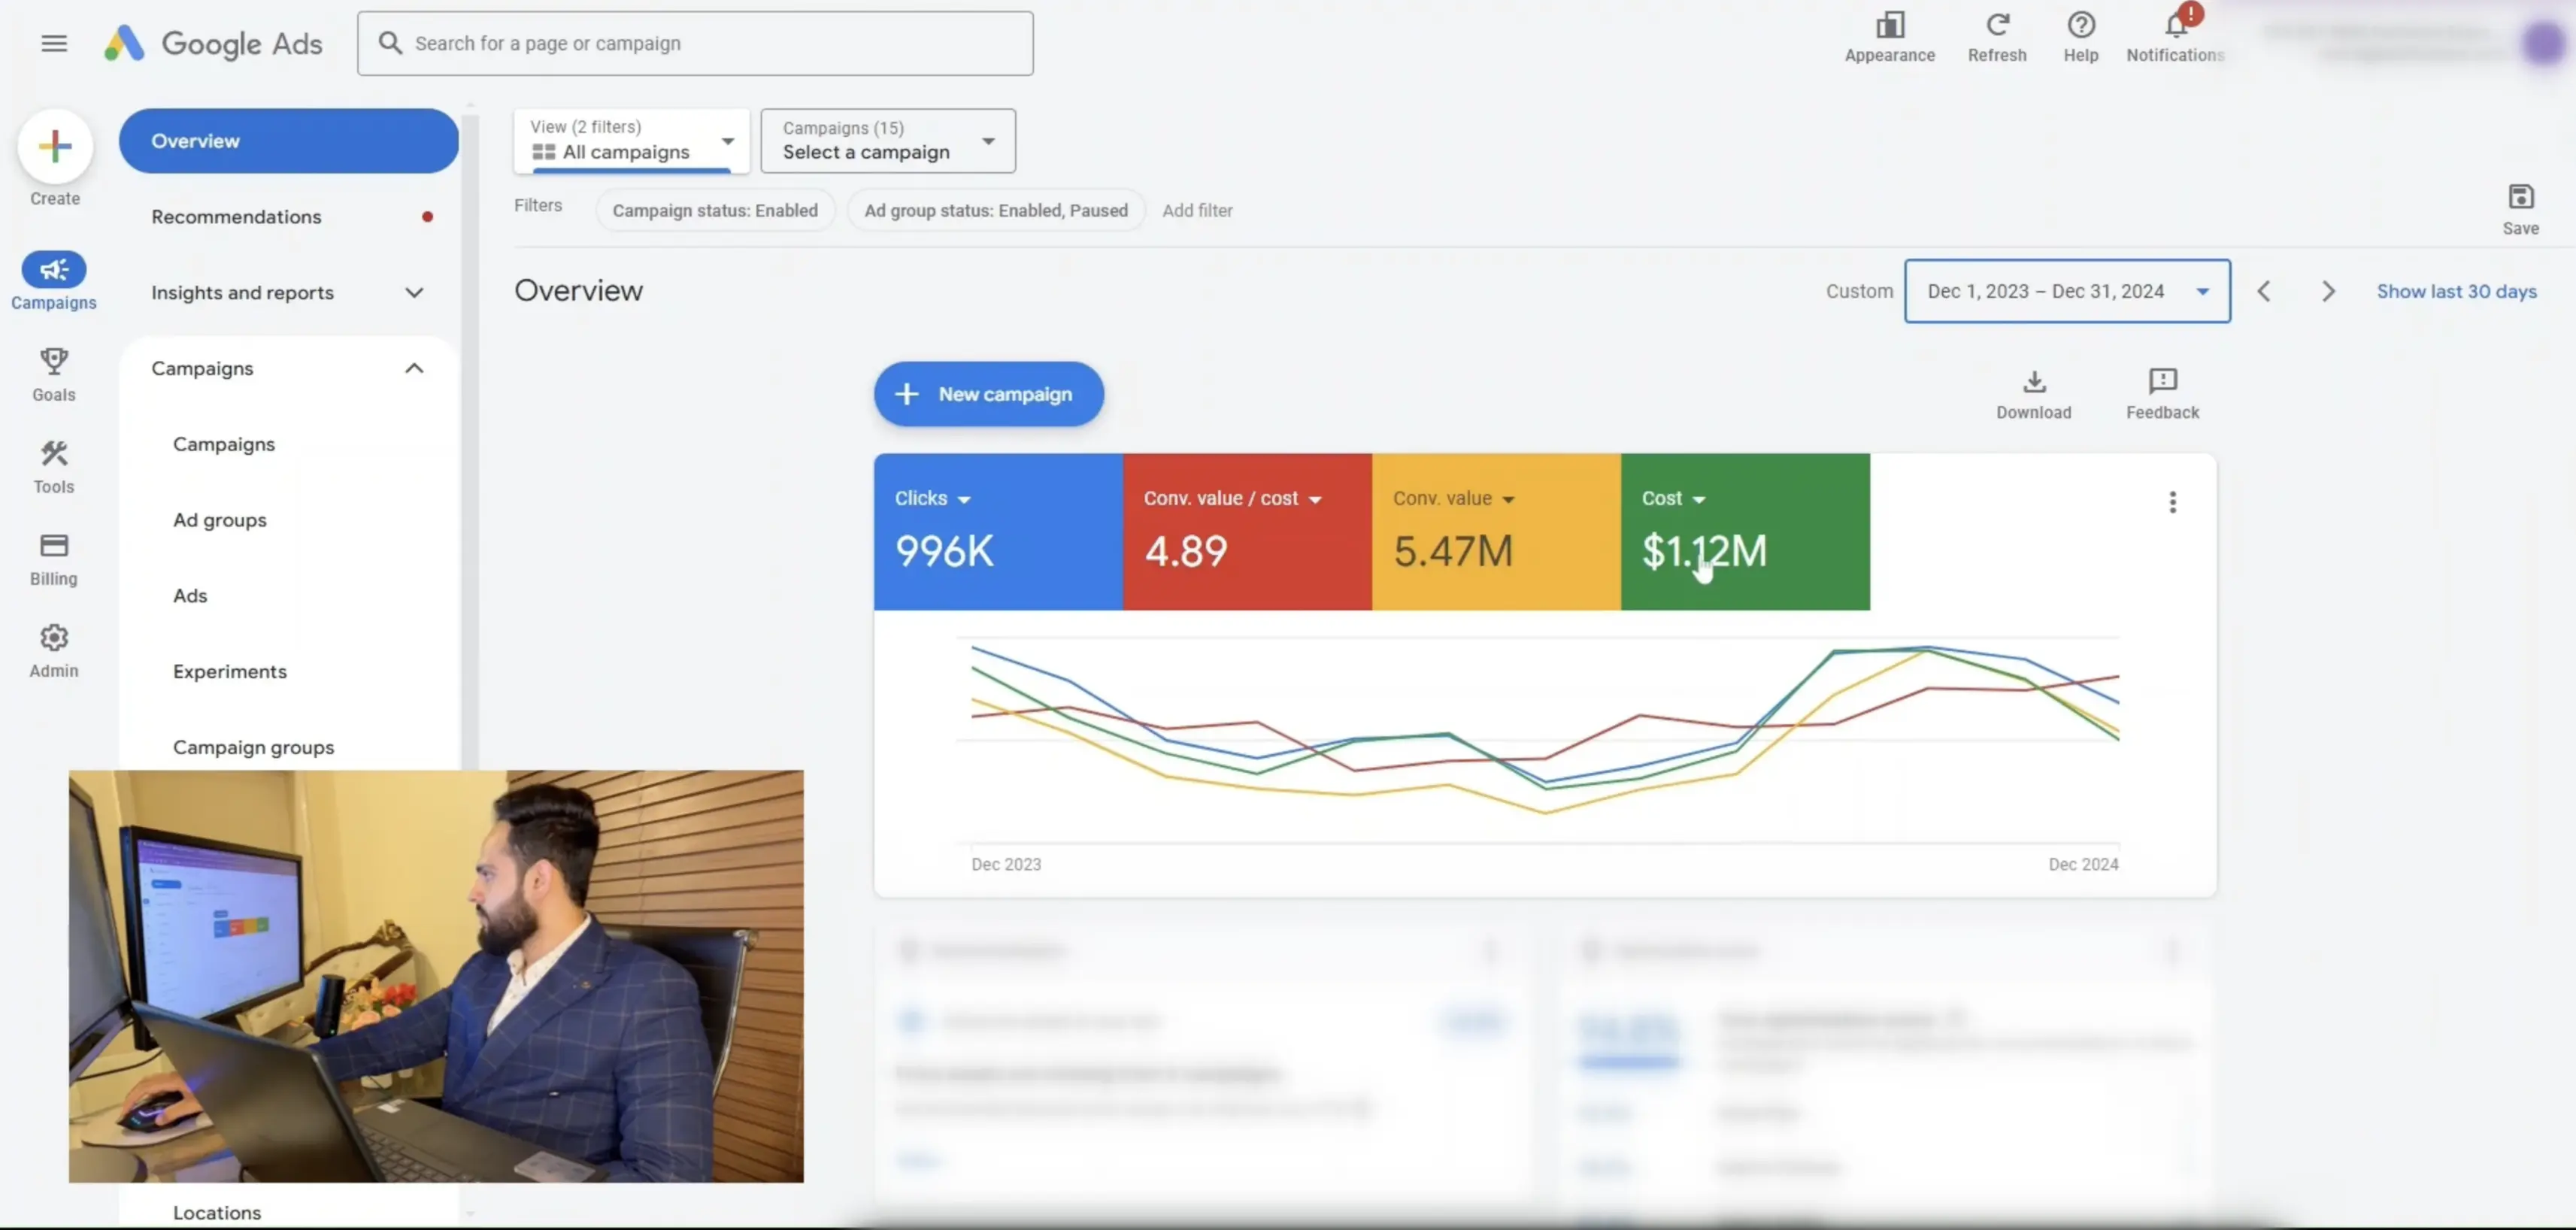
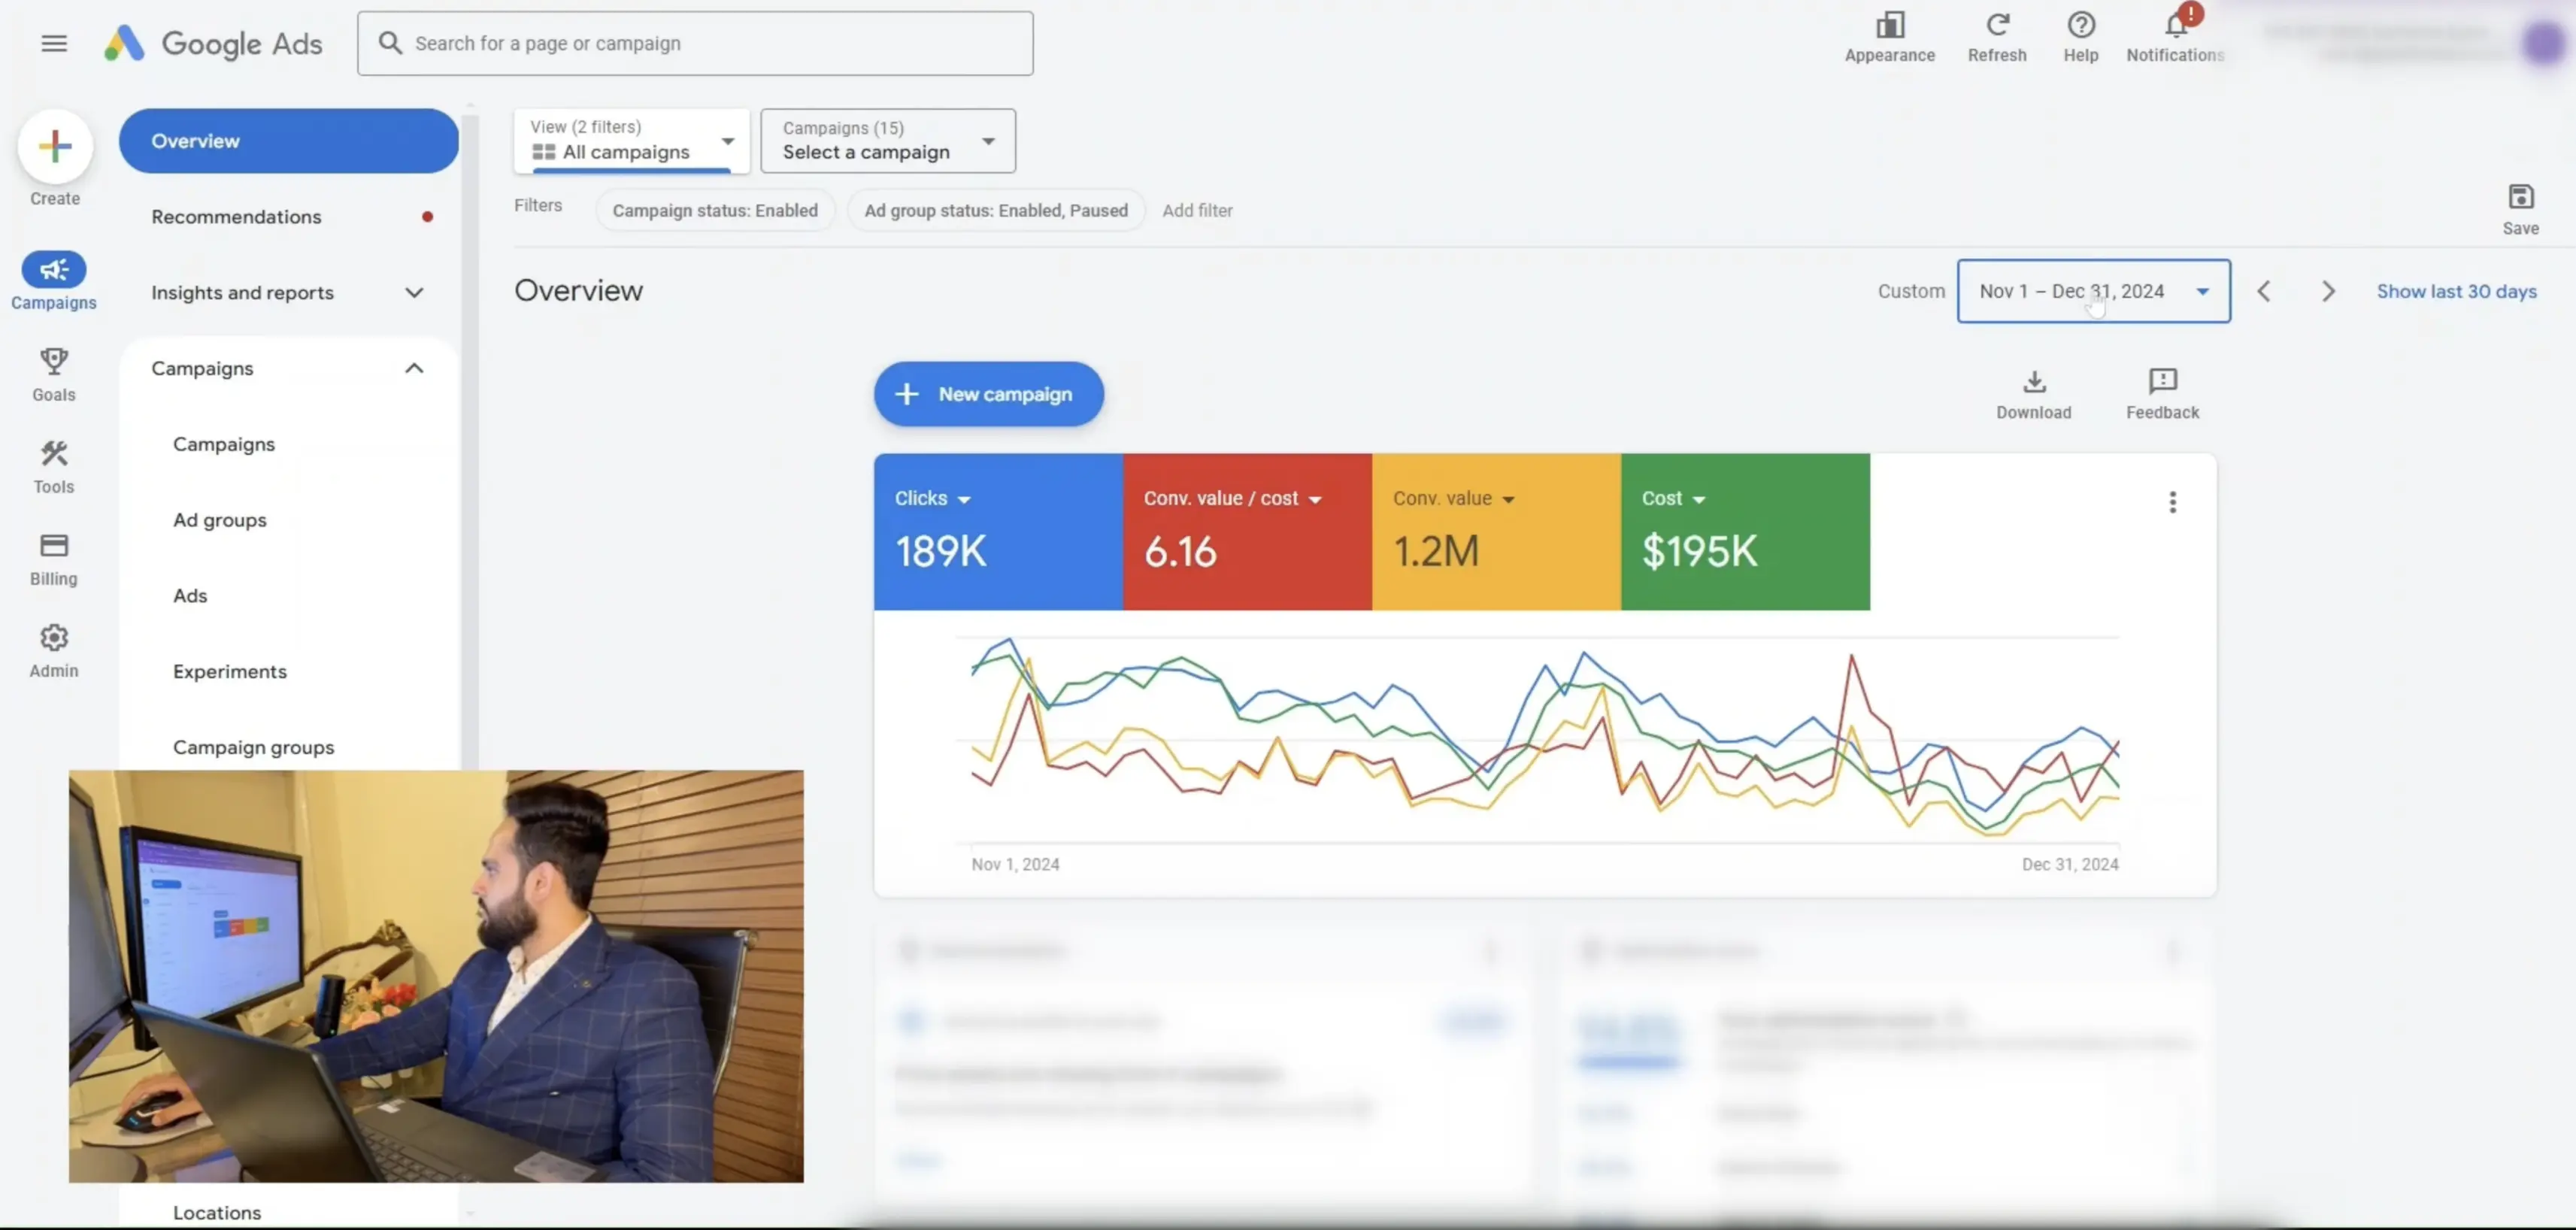
Dec 2023 to Dec 2024 performance with peak Nov-Dec proof. Every number below is supported by screenshots and walkthrough video.
Results snapshot
Client: Client name withheld | Industry: Ecommerce...
| Client | Client name withheld |
|---|---|
| Industry | Ecommerce |
| Market | United States |
| Channels | Performance Max, Search |
| Catalog size | 5,000+ SKUs |
| Timeframe shown | Dec 2023 to Dec 2024 (plus Nov-Dec 2024 highlights) |
| Revenue | $5.47M |
| Ad spend | $1.12M |
| ROAS | 4.89 |
| Proof | Full video walkthrough + screenshots |
| Last updated | 2026-02-10 |
The starting point
This was a US-focused ecommerce account scaling with two core engines: Performance Max and Search.
- Keep scale profitable with a clear ROAS target
- Avoid wasted spend from irrelevant inventory and placements
- Stop SKU-level winners being diluted by the full catalog
- Fix conversion leaks so paid traffic did not bleed margin
What we changed
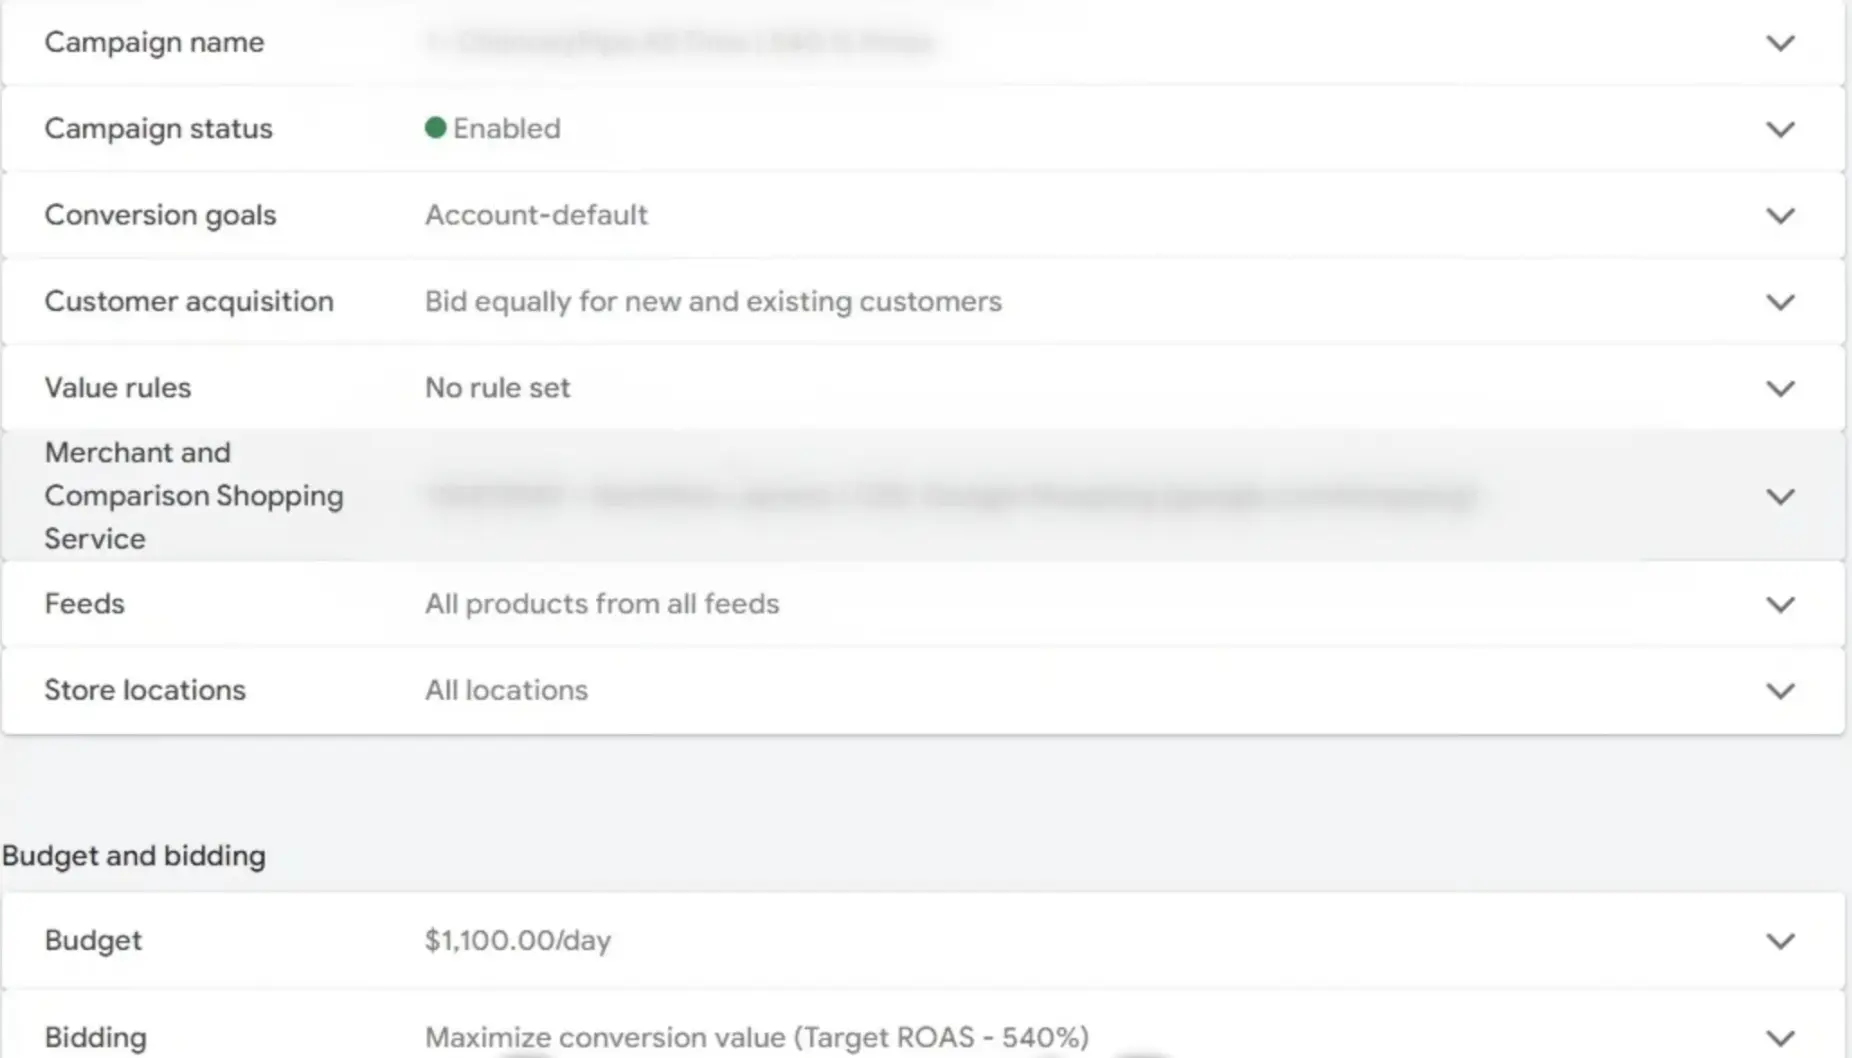
Budget roles
Spend concentration matched the best performers.
- 83% PMax
- 15% non-brand Search
- 2% brand Search
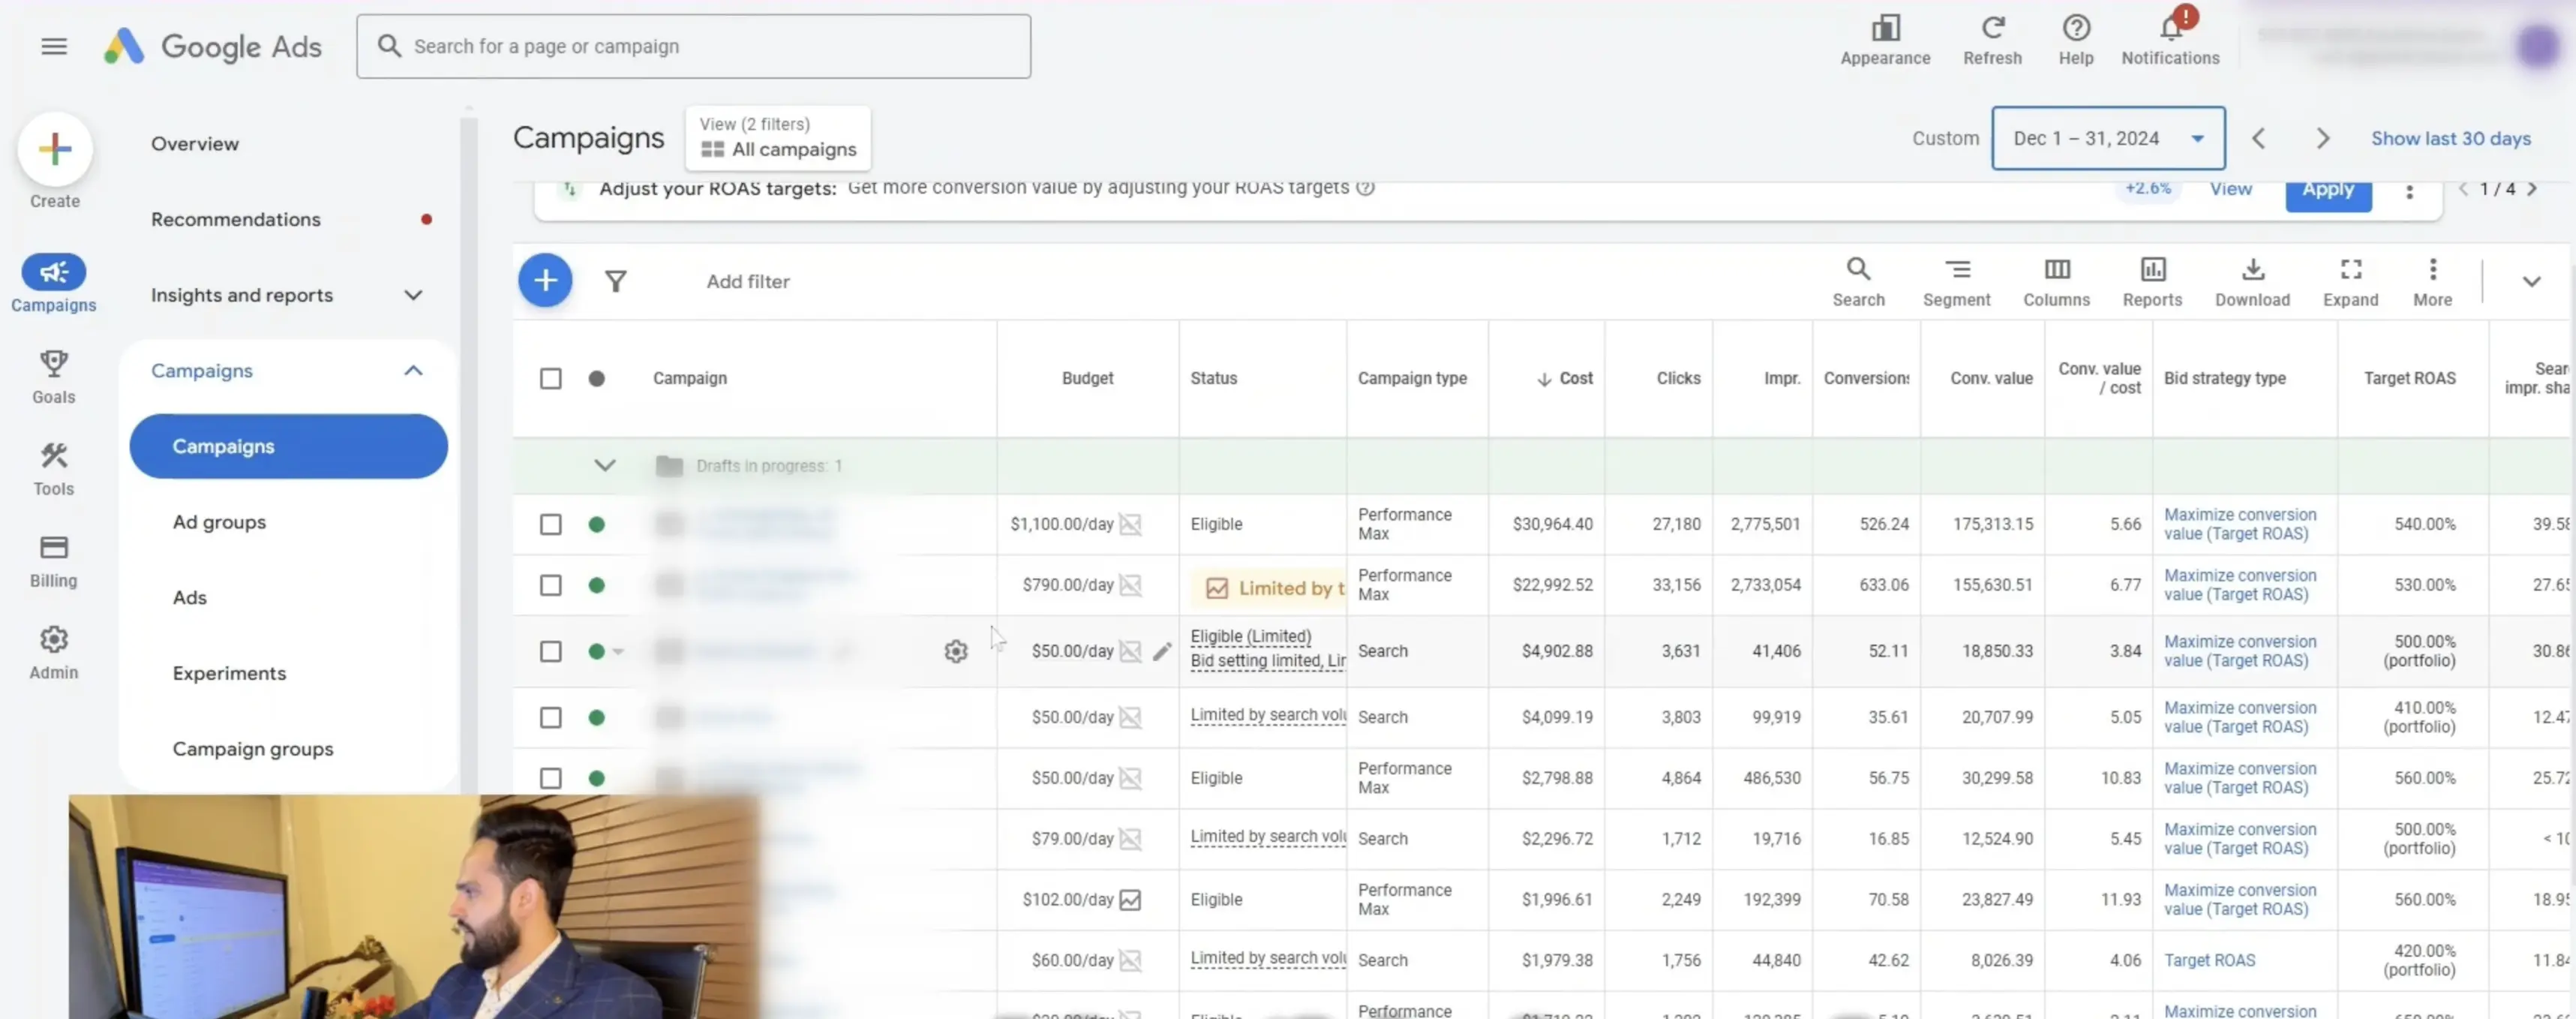
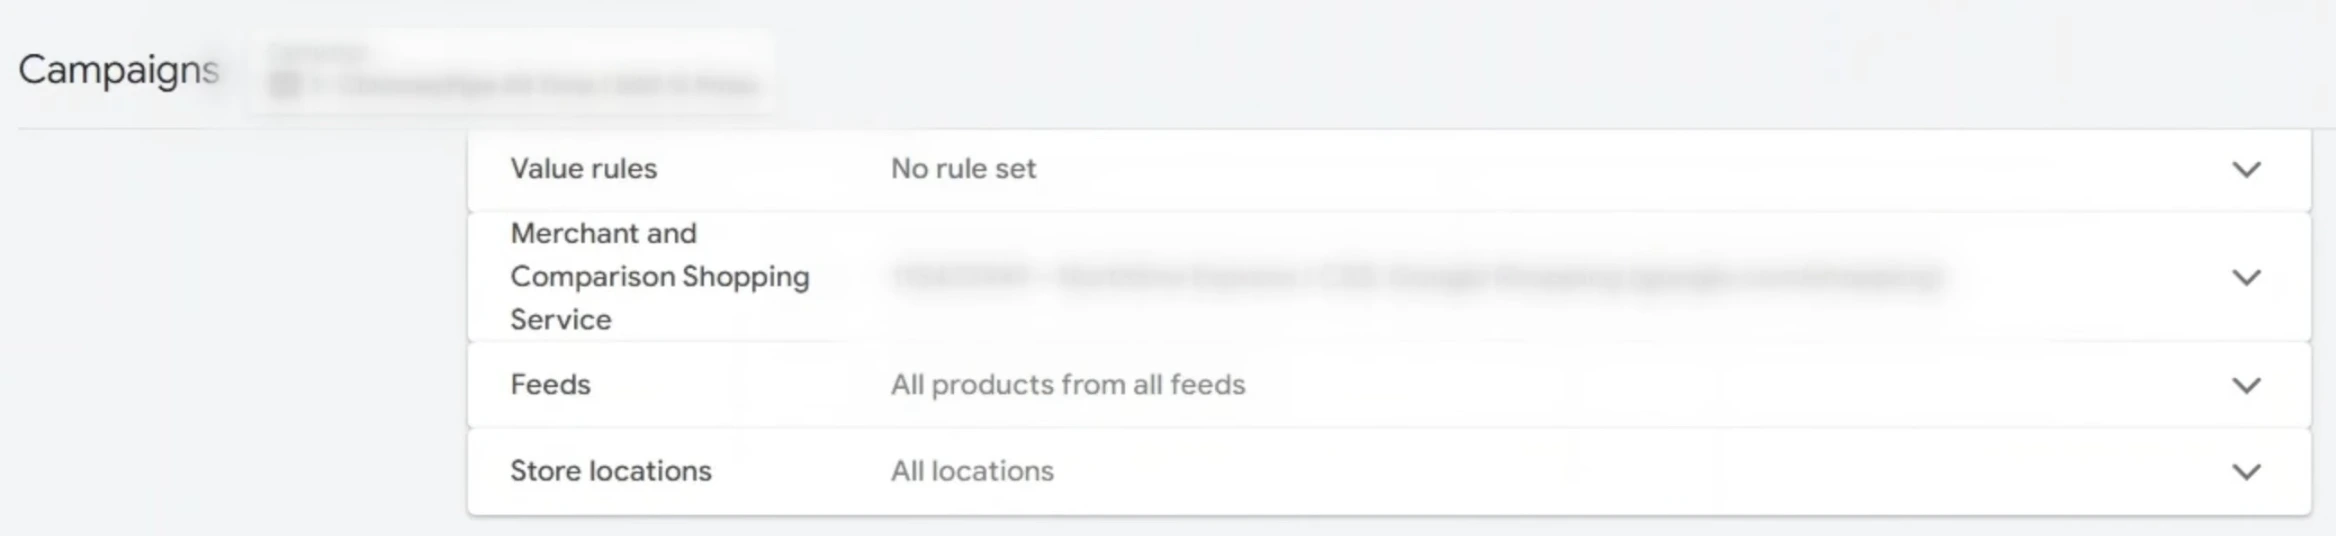
PMax structure by category and margin
We separated high-margin categories from the rest while keeping a controlled catch-all for discovery.
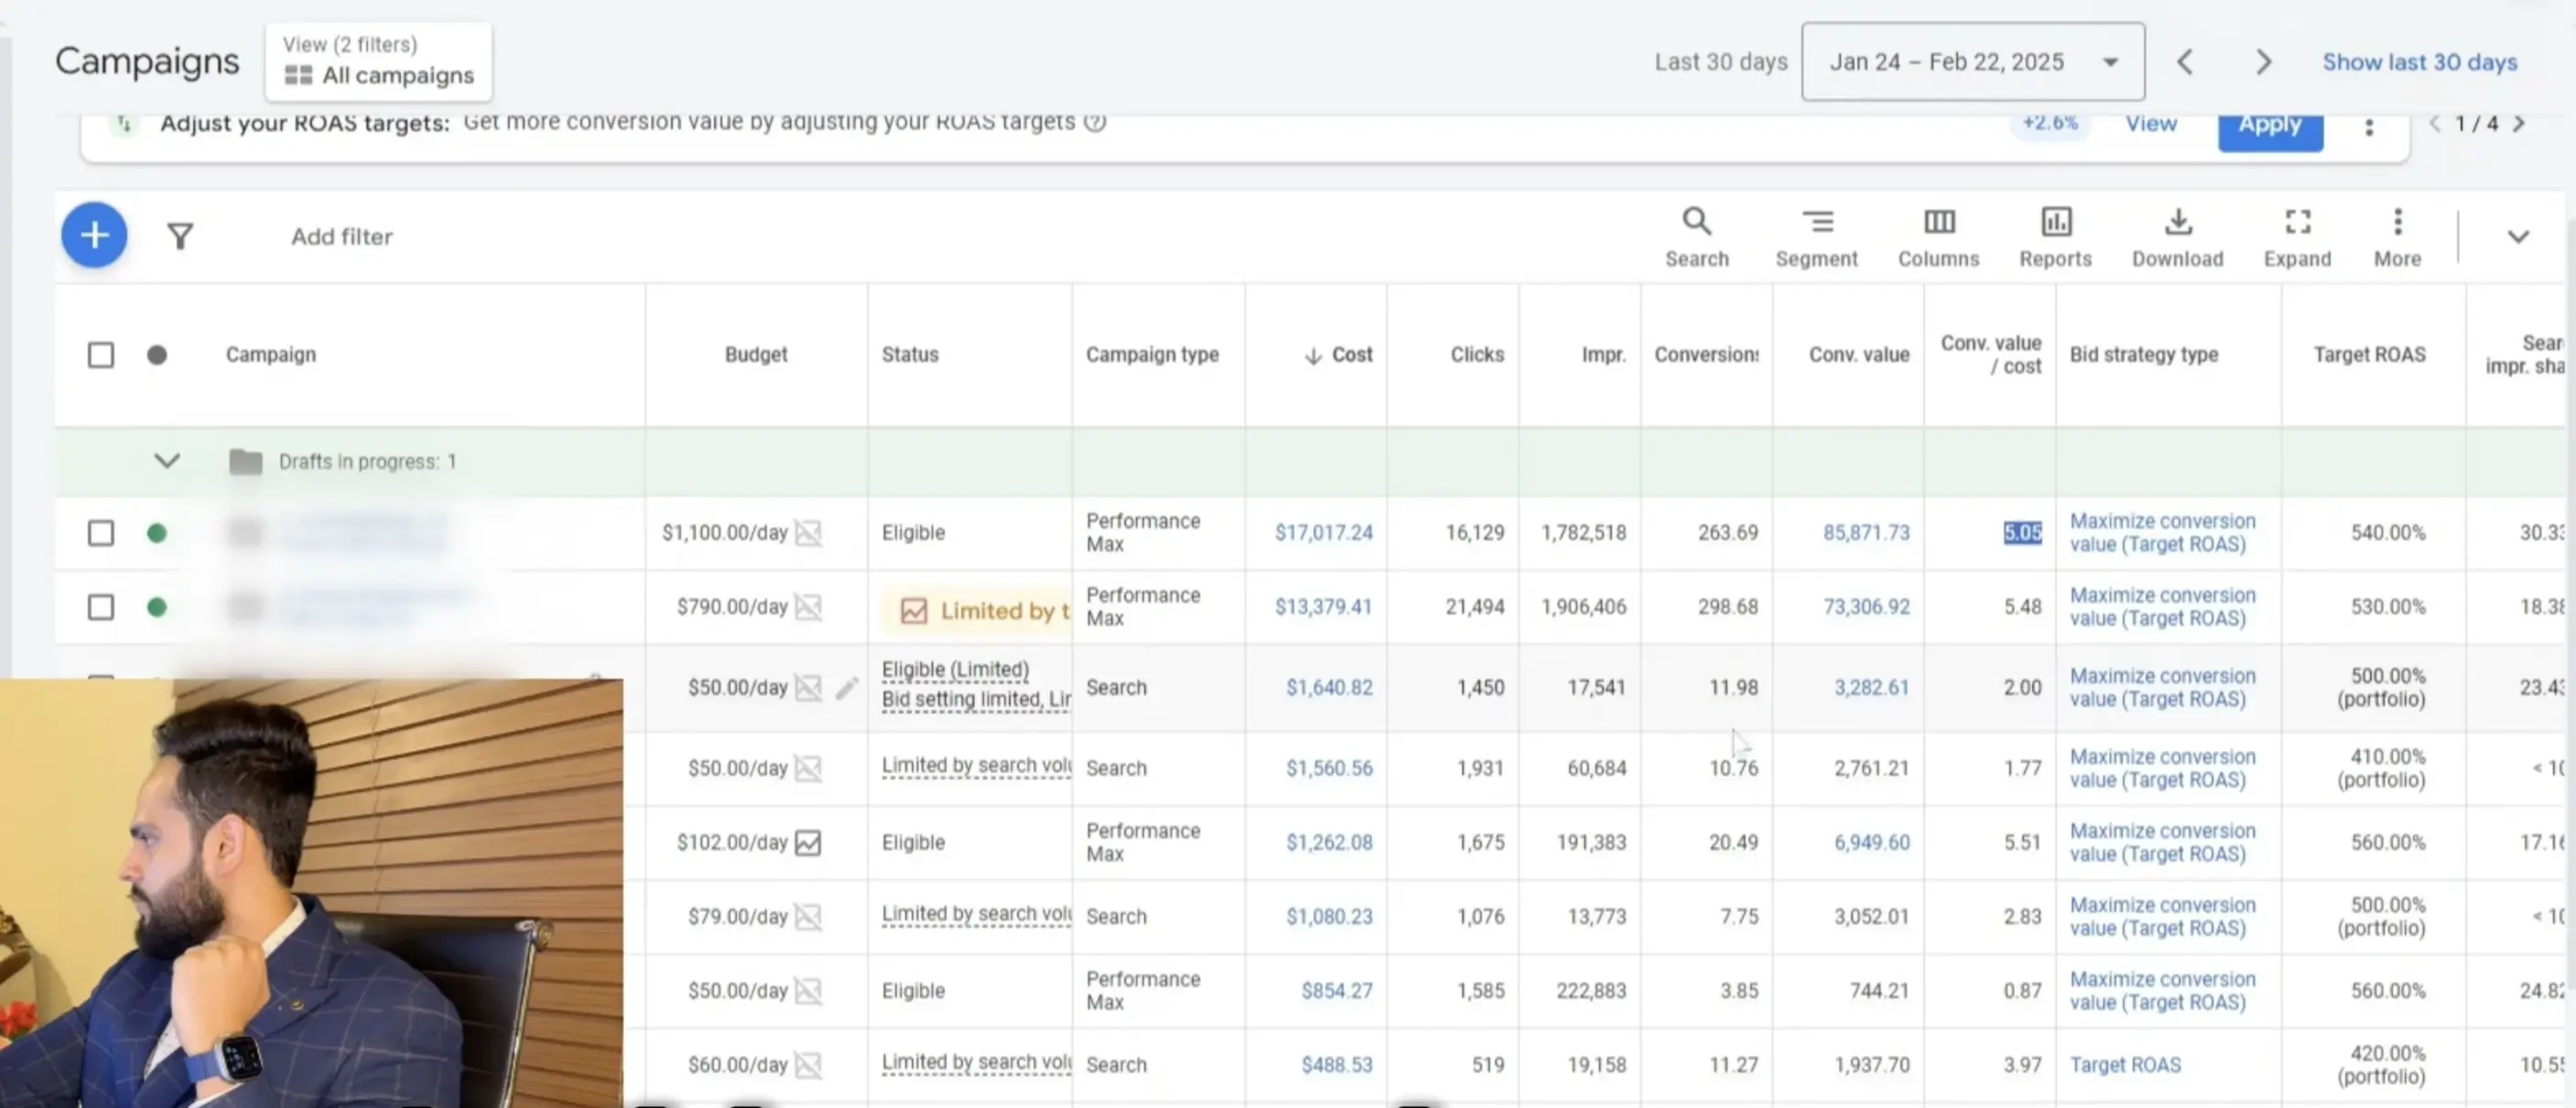
Search structure and budget role
Search captured explicit demand and defended branded coverage without starving PMax of learning data.
Audience signals
We kept signals tight: past purchasers, high-intent site users, and top product categories only.
Exclusions that stop obvious waste
Negative themes and placement exclusions prevented spend on irrelevant traffic.
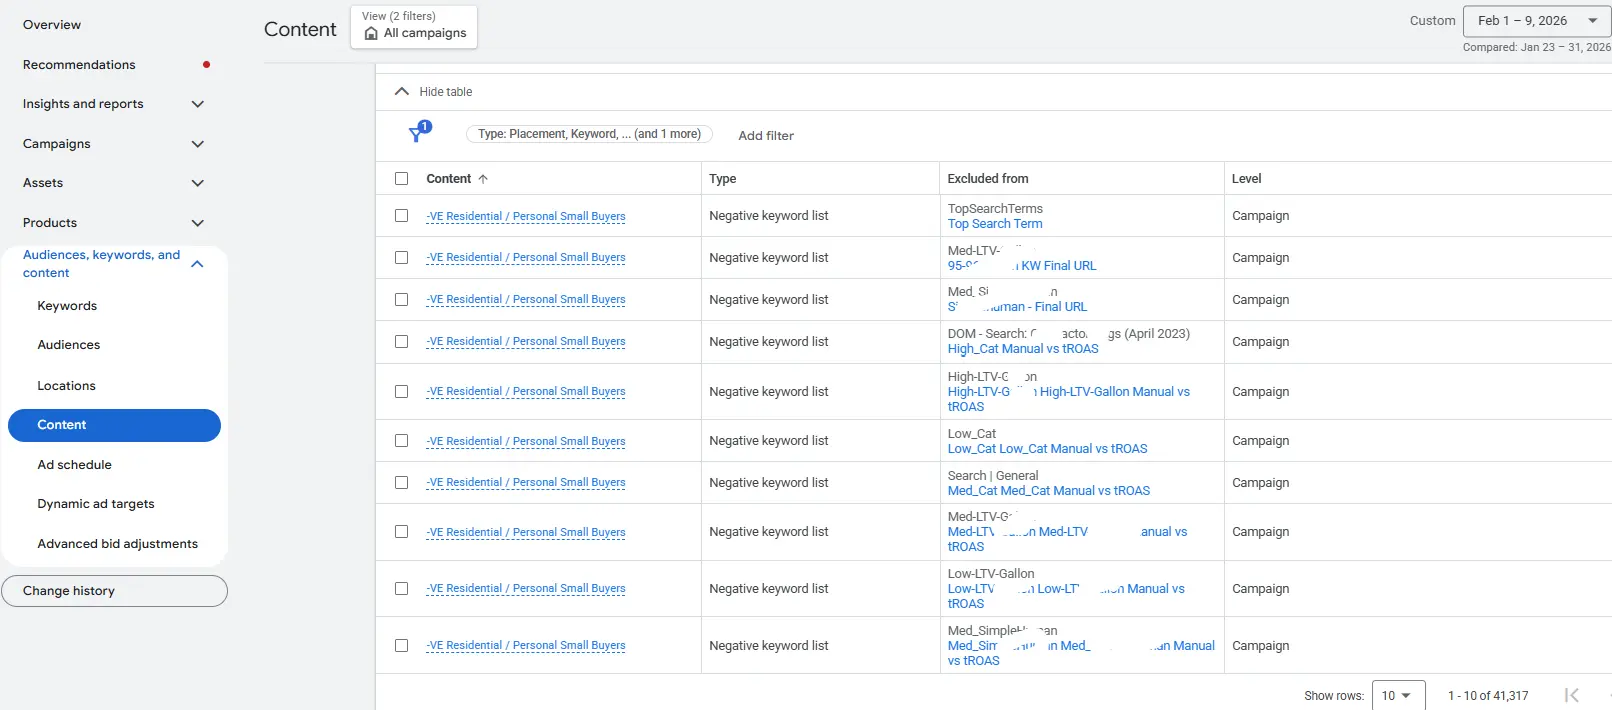
Targeting settings we do not skip at scale
SKU-level control using scripts
Performance buckets
We split inventory by performance so winners stay protected while laggards get controlled testing.
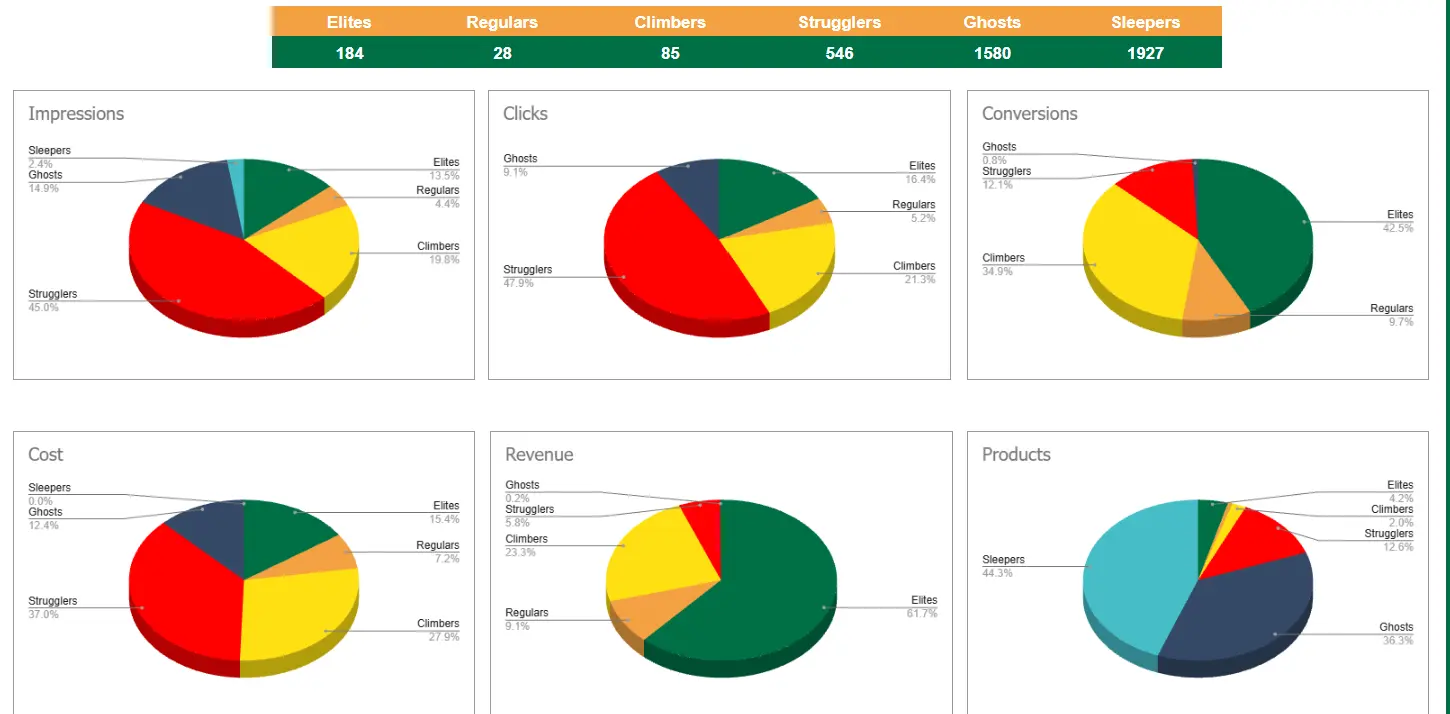
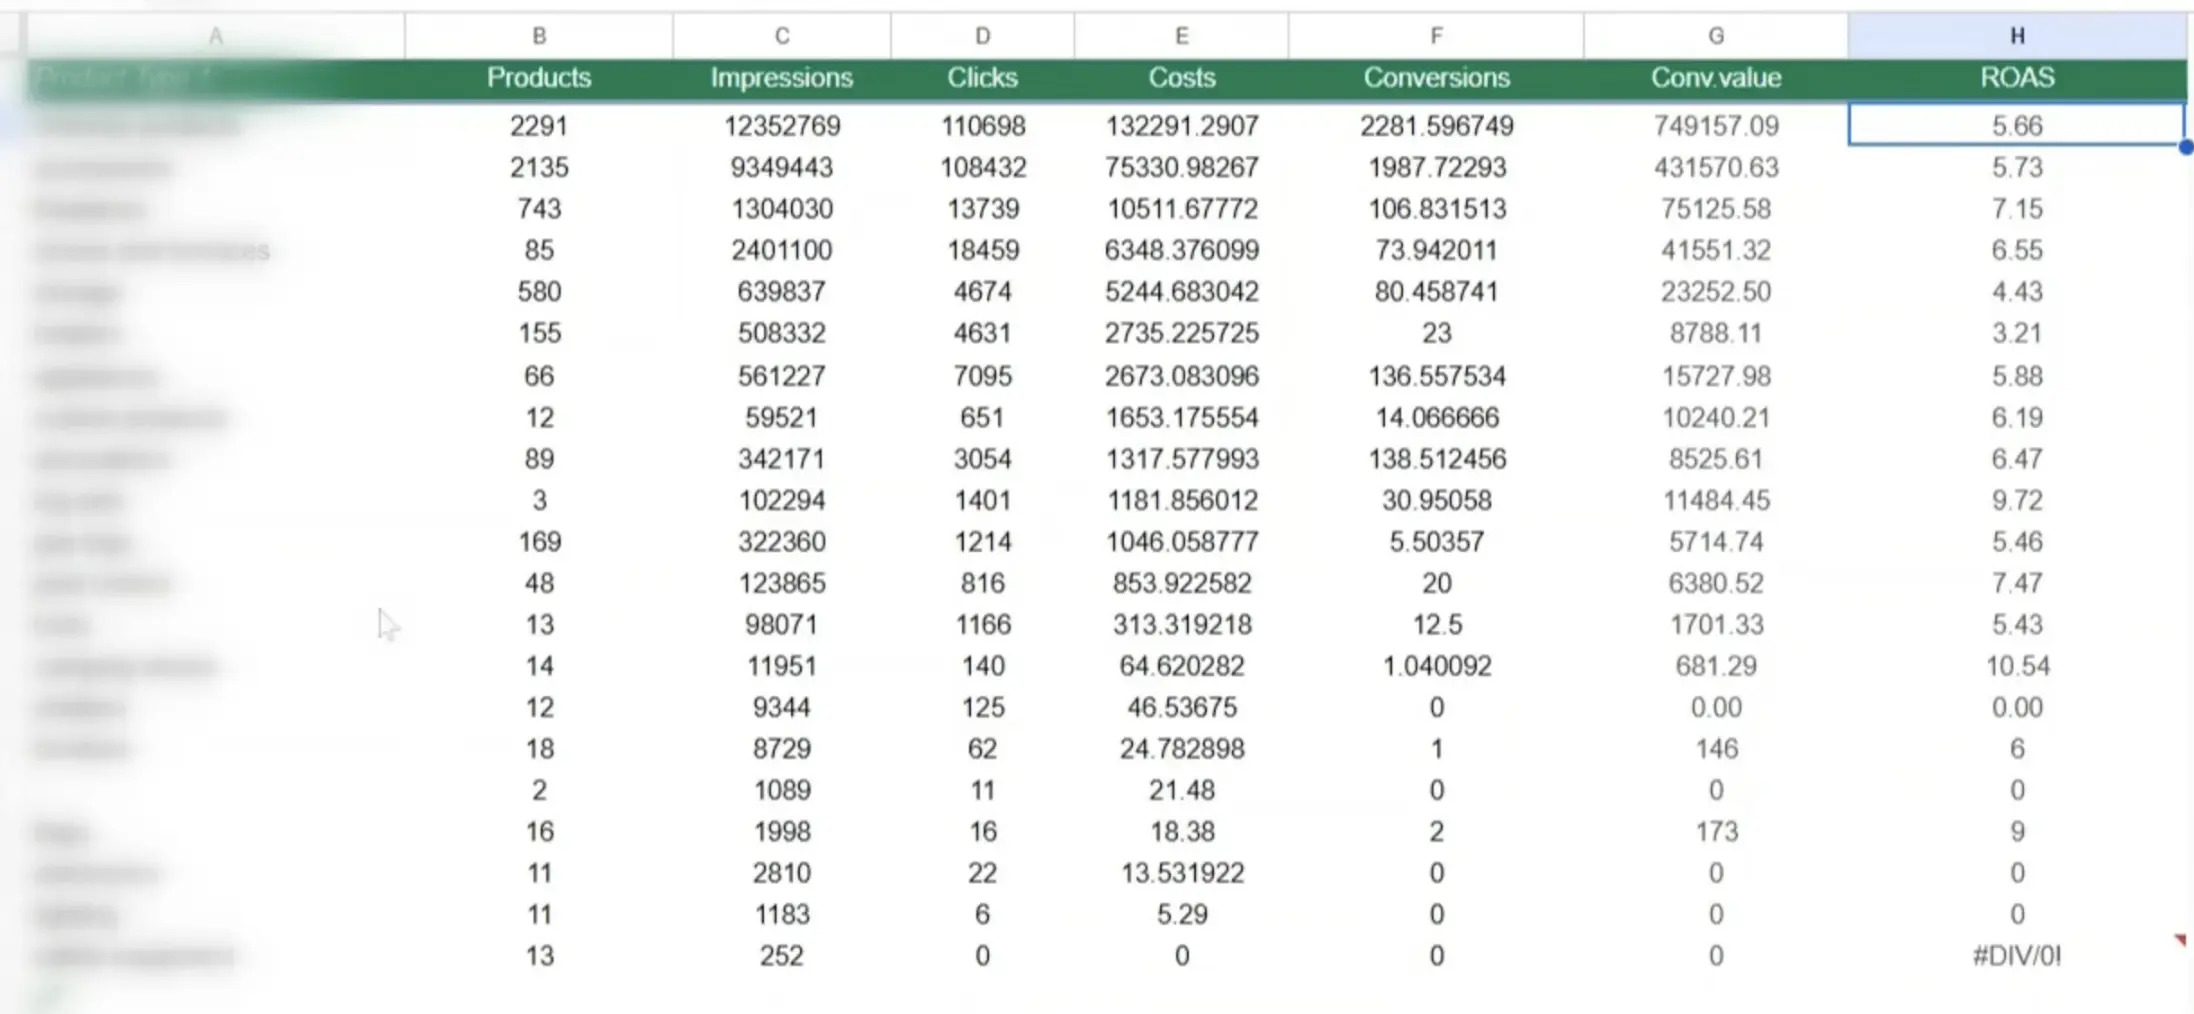
Product-type reporting
Category-level ROAS shaped merchandising focus and budget caps.
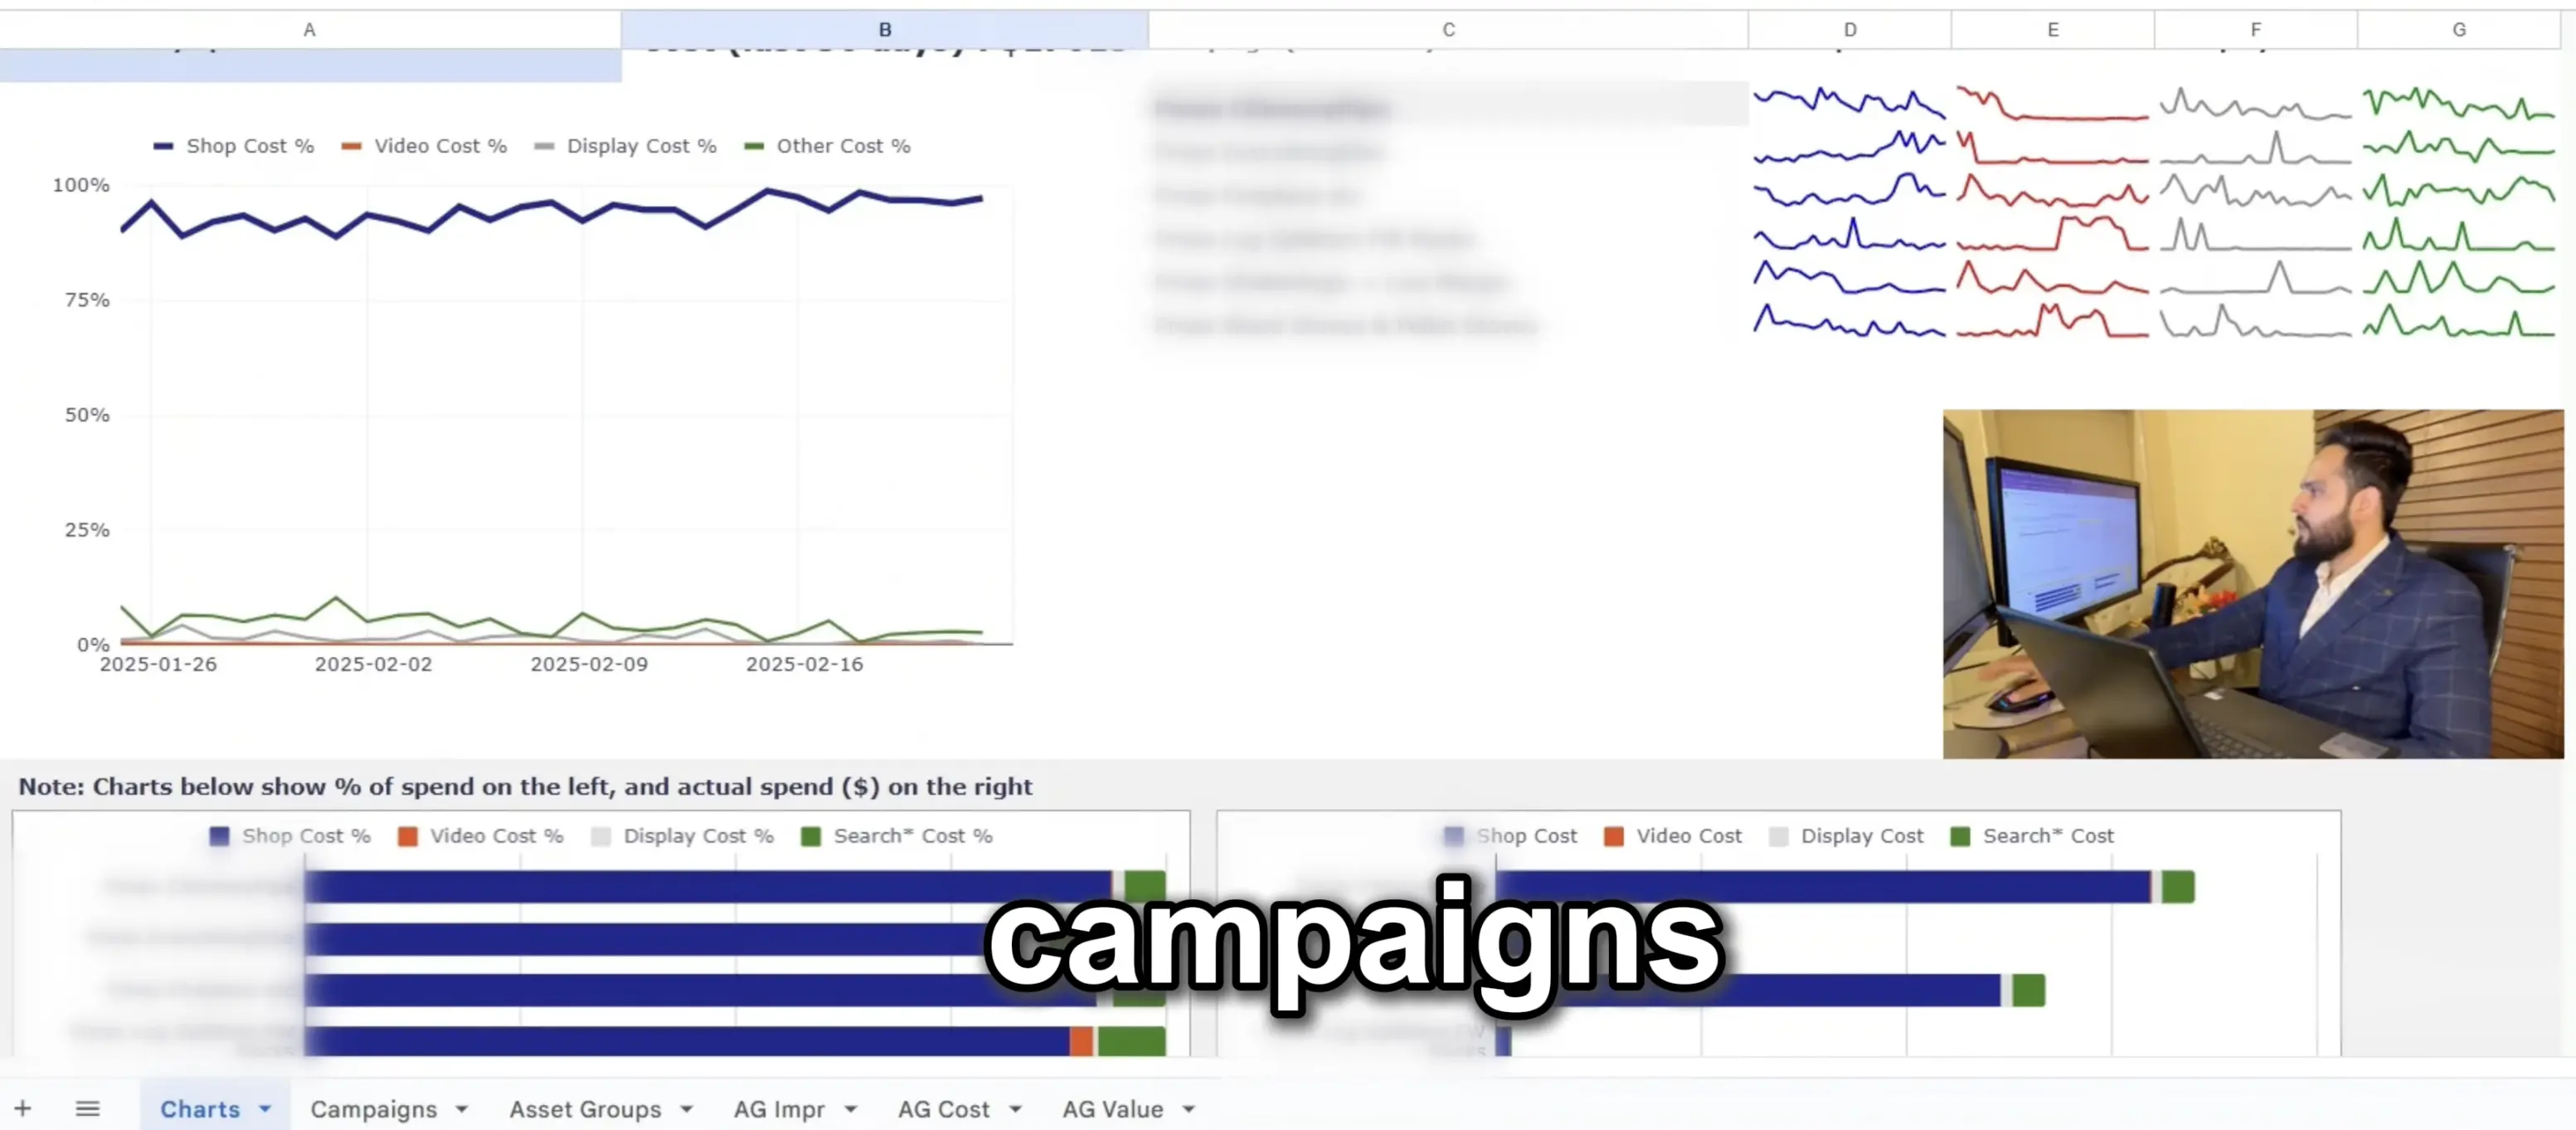
Channel spend tracking
We used scripts to estimate PMax channel mix and catch drift away from Shopping intent.
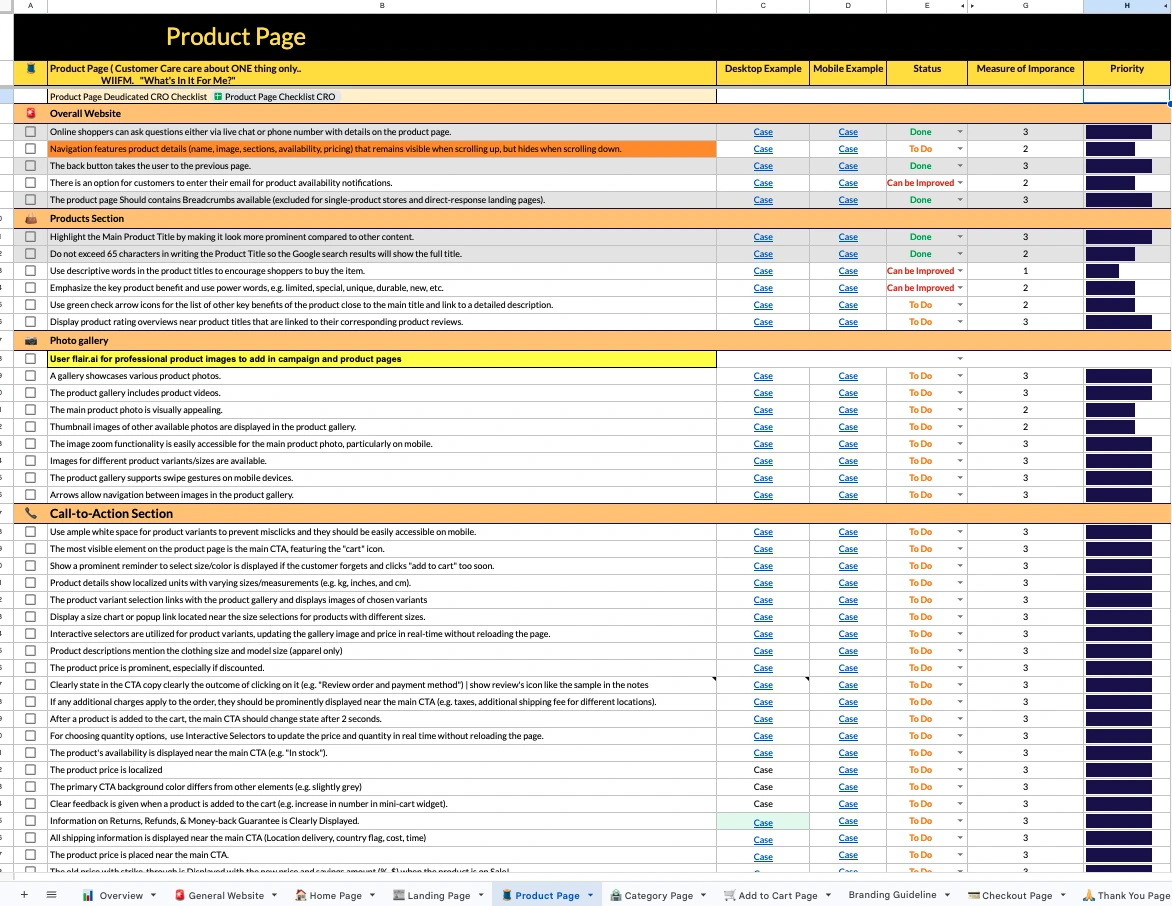
CRO checklist rollout
We used a checklist cadence to spot friction and align the site with paid traffic intent.
- Pricing format tests
- Option overload control
- Product page and checkout friction checks
Governance
- Approvals before major budget or structure changes
- Brand safety checks on placements and query themes
- Rollback plan for every experiment or structural change
How we use AI
Do
- Scan reports for anomalies and opportunity clusters
- Draft hypotheses, QA checklists, and rollout steps
- Summarize Action Logs for faster client updates
Don't
- Auto-apply bid, budget, or feed changes
- Publish creative or landing changes without review
- Trust outputs without validating against real data
Positioning line: Agentic speed, human QA.
Full walkthrough video
Watch the full walkthrough to see the live account, the performance proof, and the structural changes that made the results repeatable.
Frequently Asked Questions
Didn’t find what you’re looking for?