How We Scaled eCommerce Revenue to $276k/Month While Maintaining 550% ROAS
Full-funnel scaling using Search, PMax, Display, and a strict checklist rhythm.
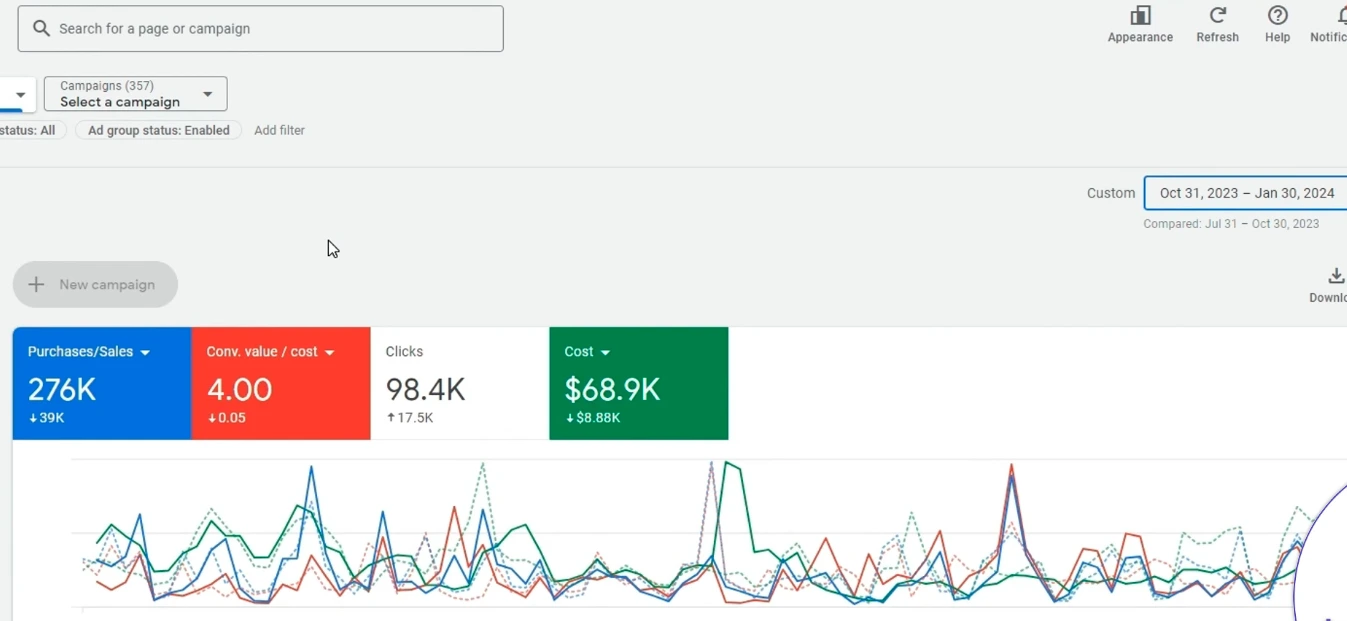
- $276k month revenue (peak)
- 5.50 ROAS (550%)
- $68k month spend (peak)
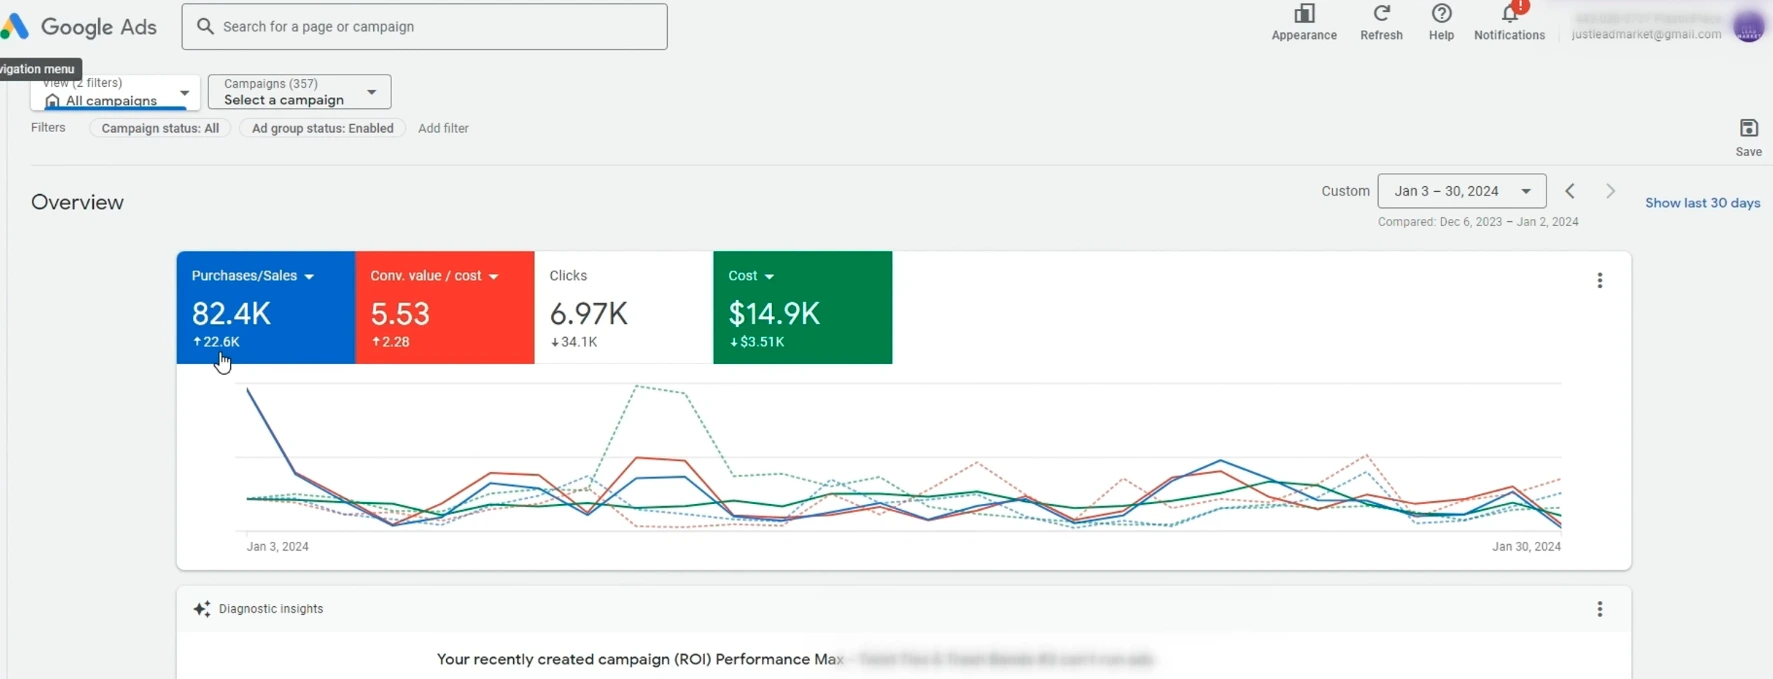
- Reduced spend $3k while adding $22k revenue
All performance numbers shown come from platform reporting and internal campaign logs. We do not publish client-private identifiers, audience lists, or product-level data.
Results snapshot
Client Industry: eCommerce (Multi-Product) | Market: Global / US...
| Client Industry | eCommerce (Multi-Product) |
|---|---|
| Market | Global / US |
| Primary Strategy | Full Funnel (Search + PMax + Display + Shopping) |
| Key Framework | 3-Day & Weekly Optimization Checklists |
| Peak Revenue | $276,000 / month |
| Peak Ad Spend | $68,000 / month |
| Efficiency ROAS | 5.50 (550%) |
| Recent Win | Reduced spend by $3k while adding $22k Revenue |
| Last Updated | 2026-02-16 |
The Challenge: Improving Efficiency While Scaling
Scaling is usually messy. Most Google Ads agencies can spend more money, but few can spend more while lowering your Cost Per Acquisition (CPA).
This e-commerce brand needed to:
- Cut wasted spend on broad, irrelevant traffic.
- Scale volume during peak months (Q4) without crashing ROAS.
The goal was to move from a chaotic ad account to a structured Complete Funnel that captured demand at every stage.
The Strategy: The Checklist Framework
The account was rebuilt around a predictable Optimization Rhythm that covered account health, creative iteration, and spend governance.
- Every 3 Days: Search terms, budget drift, and feed quality checks.
- Weekly: Bid strategy adjustments and creative performance review.
- Monthly: Full-funnel allocation and structure-level cleanup.
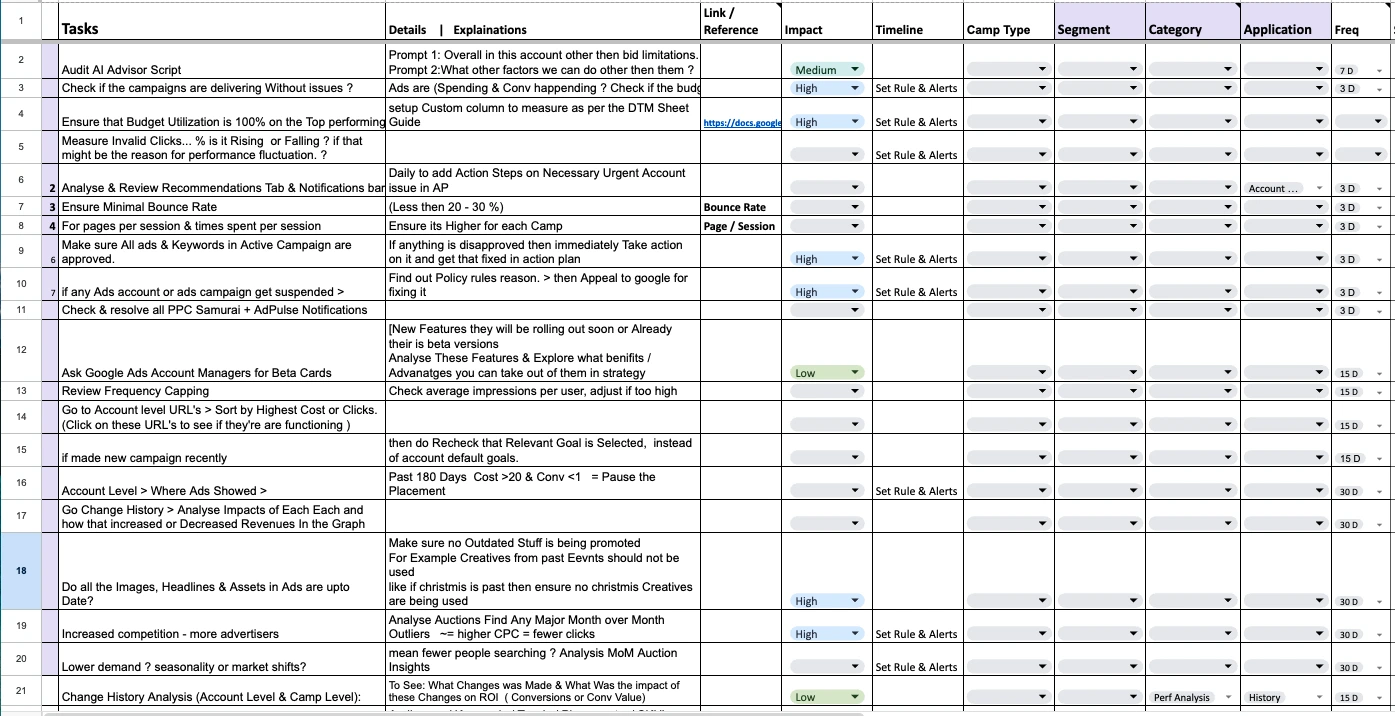
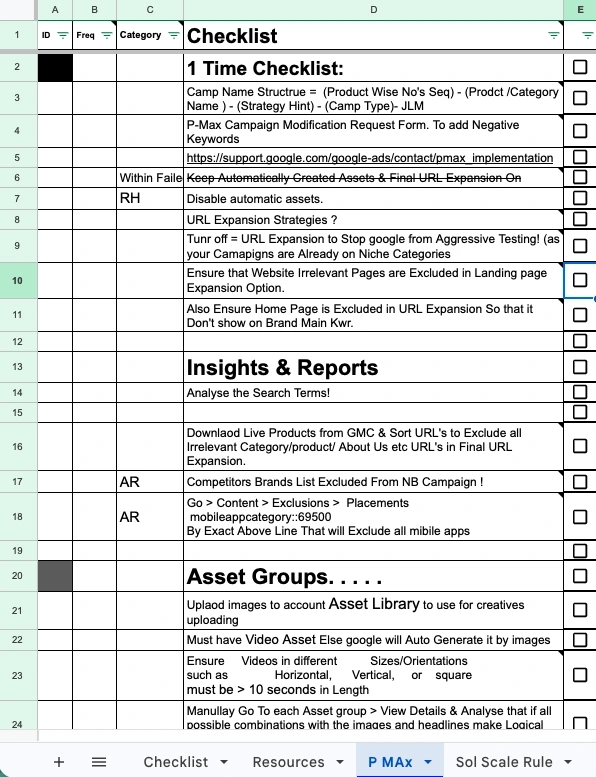
Specialized PMax Governance kept performance stable while spend increased. We layered controls across Search and Performance Max or Shopping so scale did not erode quality.
The Execution: Tailored Media Planning
Unlocking Hidden Revenue
With tighter allocation and placement controls, we reduced spend by $3,000 while increasing revenue by $22,000 in a single month. The media plan stayed flexible, but decision rules stayed strict to protect efficiency.
This same discipline applies across every Google Ads account we manage when the goal is profitable scaling.
The Results: 550% ROAS & Consistent Growth
- Efficiency Mode: ~$80,000 Revenue on ~$15,000 Spend (5.5 ROAS)
- Scaling Mode: ~$276,000 Revenue on ~$68,000 Spend (4.0 ROAS)
- Trend: Consistent growth in Conversion Value year-over-year
Back to Results for more breakdowns from similar eCommerce growth accounts.
Watch the Full Account Walkthrough
A live look at the Checklist Framework and the 550% ROAS results.
Frequently Asked Questions
Didn’t find what you’re looking for?
Is Your Ad Spend Working as Hard as You Are?
If your account is stuck at a revenue plateau, we will isolate what is holding growth back across structure, Product Feed quality, and budget distribution.
Request your Get a Just Free Audit to get a practical roadmap to higher-efficiency scaling.
Get a clear 30-day roadmap to profitable scaling.