Why Shopify Analytics vs Google Analytics Never Match
Shopify counts every order at checkout, on the order date. Google Analytics counts tracked sessions and splits credit across channels. Google Ads counts claimable conversions and books them on the click date, not the purchase date (Google Ads Help, as of 2026). Three systems, three jobs, three clocks. A gap is expected, not broken.
| Shopify Admin | Google Analytics 4 | Google Ads | |
|---|---|---|---|
| Counts | Every order, server side | Tracked, consented sessions | Conversions an ad can claim |
| Attribution | None | Data-driven, fractional | Data-driven, fractional |
| Reporting date | Order date | Event date | Click date |
| Data loss | Near zero | Consent, blockers, Safari ITP | Same, partly offset by modeling |
Two more mechanics widen the gap. Consent Mode v2 has been required for EEA ad personalization since March 2024 (Google), and Safari's ITP caps JavaScript-set cookies at 7 days (WebKit documentation). Shopify's server-side order record is immune to both, which is why Shopify almost always reports more than GA4. In one seasonal account JLM manages, Google Ads was attributed roughly 25% of booked Shopify revenue while the business was healthy (JLM client data, 2026). The gap is a channel-mix reading, not an error score.
The point of understanding this is not to force the numbers to agree. It is to earn trust in one specific view: revenue by SKU. That view drives everything that follows.
Step Zero: Make the SKU Data Trustworthy
Before any budget decision, build one matched-window, SKU-level sheet where Shopify revenue and Google Ads spend sit side by side and every gap has a named cause. This takes a few hours. Skipping it means running the strategy on data that Smart Bidding itself may be distorting.
The condensed reconciliation:
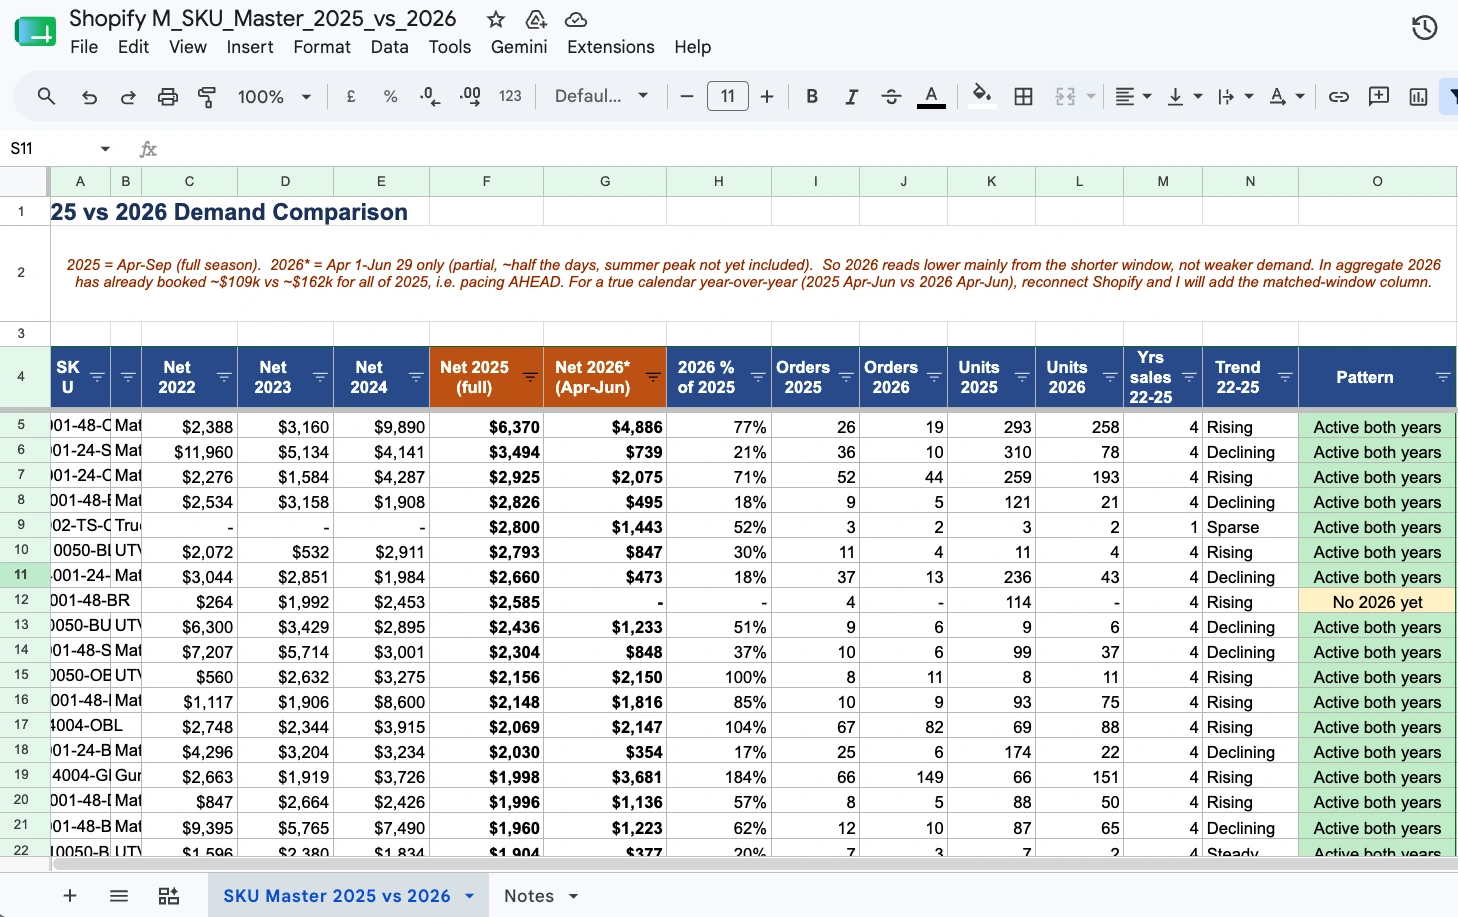
- Freeze the frame: same date range, same timezone, on both platforms. Unequal windows are the top cause of false alarms. One JLM client looked 50% down per SKU while actually pacing well ahead; matched-window math showed 67% of last season's revenue booked at the 49% time mark (JLM, 2026).
- Export Shopify orders by variant SKU and the Google Ads product report for the same range.
- Dedupe the Ads export. Roughly half the rows in a Google Ads product report CSV can be platform-prefixed duplicates carrying $0 metrics (JLM, 2026). Drop them.
- Uppercase SKUs on both sides and join on that key.
- Roll variants up to base products. Google credits the clicked variant, Shopify books the bought variant.
- Check the plumbing: one primary purchase action, transaction IDs present, Enhanced Conversions active.
One shape check before moving on: Shopify highest, GA4 lower, Ads lowest is the normal shape. Google Ads revenue exceeding Shopify net sales over a matched window is the broken shape, and it usually means duplicate tags or missing transaction IDs. Fix that before touching budgets, because bidding trained on double-counted purchases spends confidently toward fiction.
The Payoff: Top Revenue SKUs Should Take the Top Ad Spend
Here is the question the reconciled sheet exists to answer: are the products that make your money the products that get your budget? Rank every SKU by Shopify net revenue. Rank every SKU by Google Ads spend. If the two lists disagree at the top, you are funding the wrong catalog.
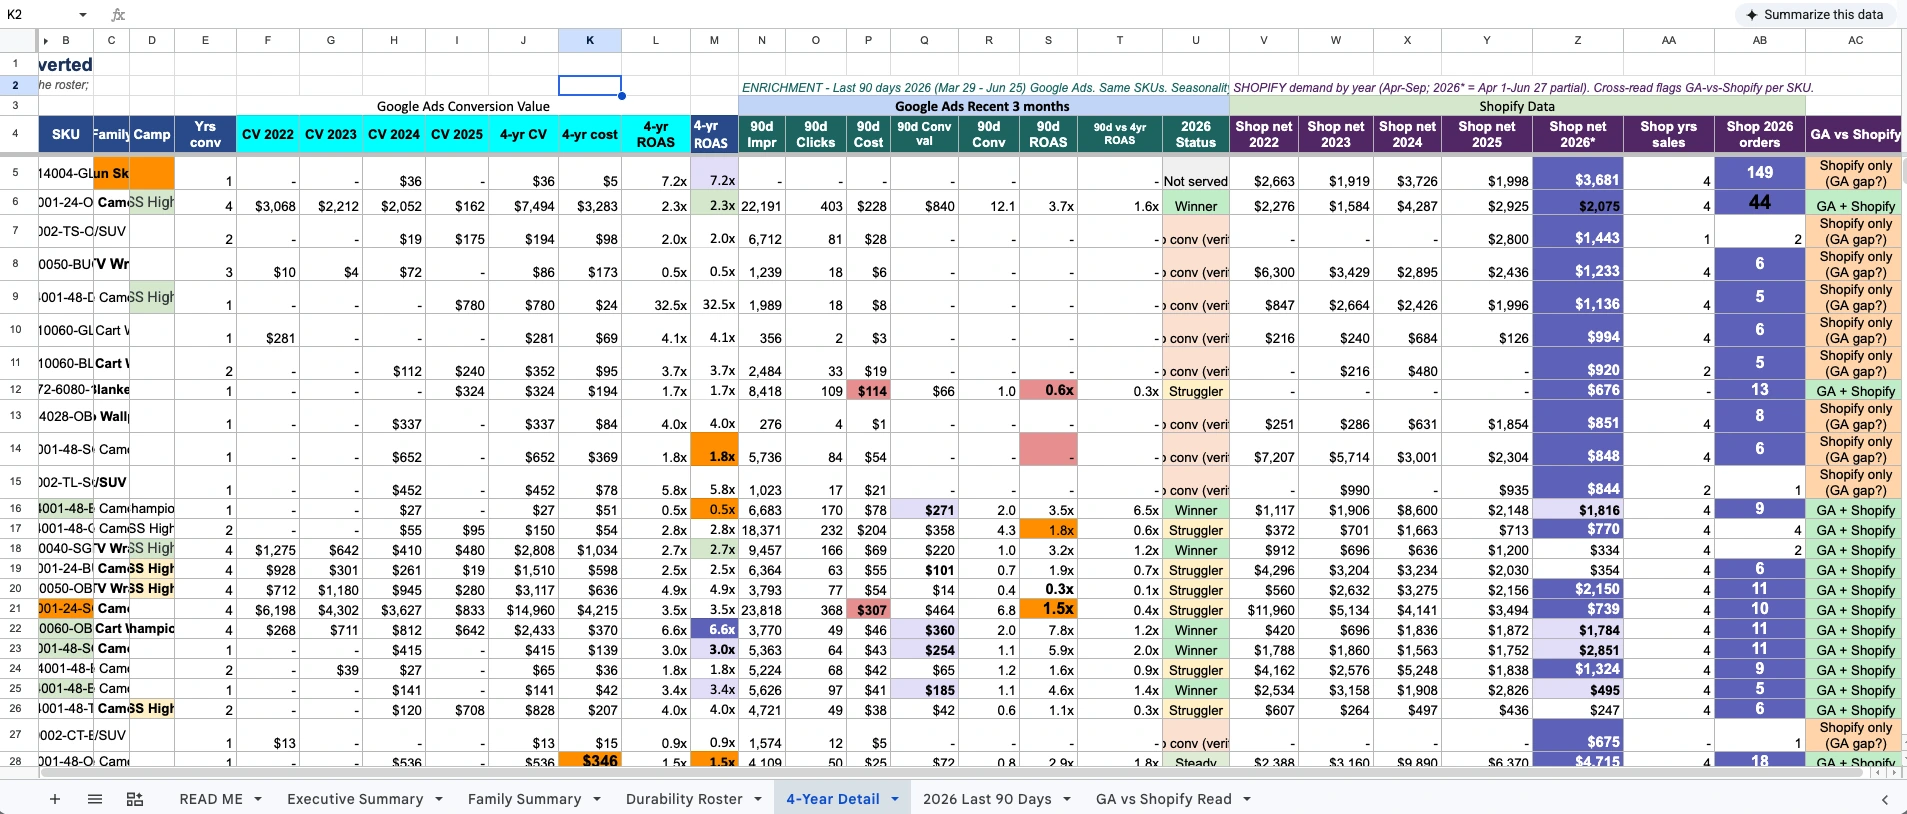
This is the audit JLM ran on a seasonal ecommerce account. Every SKU was ranked by Shopify net revenue for the season. Deduplicated ad spend was mapped to the same SKUs over the same window. The finding in this account was the aligned state: the top 20 revenue-generating SKUs in Shopify were confirmed to be absorbing the largest share of Google Ads spend, so money was flowing to the dimensions that generate money (JLM client data, 2026).
The concentration behind that alignment is sharp. In the same account, roughly 35 winning SKUs produced about 75% of all ad-attributed conversion value (JLM client data, 2026). Revenue concentrates. Spend should concentrate with it. When it does not, one of two silent failures is running: winners are starved while budget leaks across the long tail, or losers are funded because they are clickable rather than profitable. Smart Bidding optimizes toward conversion signals, not toward your margin. Without SKU-level control, budget drifts to whatever converts cheapest, which is often not what earns most.
The SKU Spend Alignment Audit in 8 Steps
The audit compares each SKU's share of Shopify revenue against its share of Google Ads spend, then flags three misalignment patterns for action. It runs on the reconciled sheet from Step Zero and takes about an hour once the data is clean. Re-run it monthly.
- Rank SKUs by Shopify net revenue for the matched window. Mark the top 20.
- Compute revenue share per SKU: SKU revenue divided by total revenue.
- Compute spend share per SKU from the deduplicated Ads export: SKU spend divided by total spend.
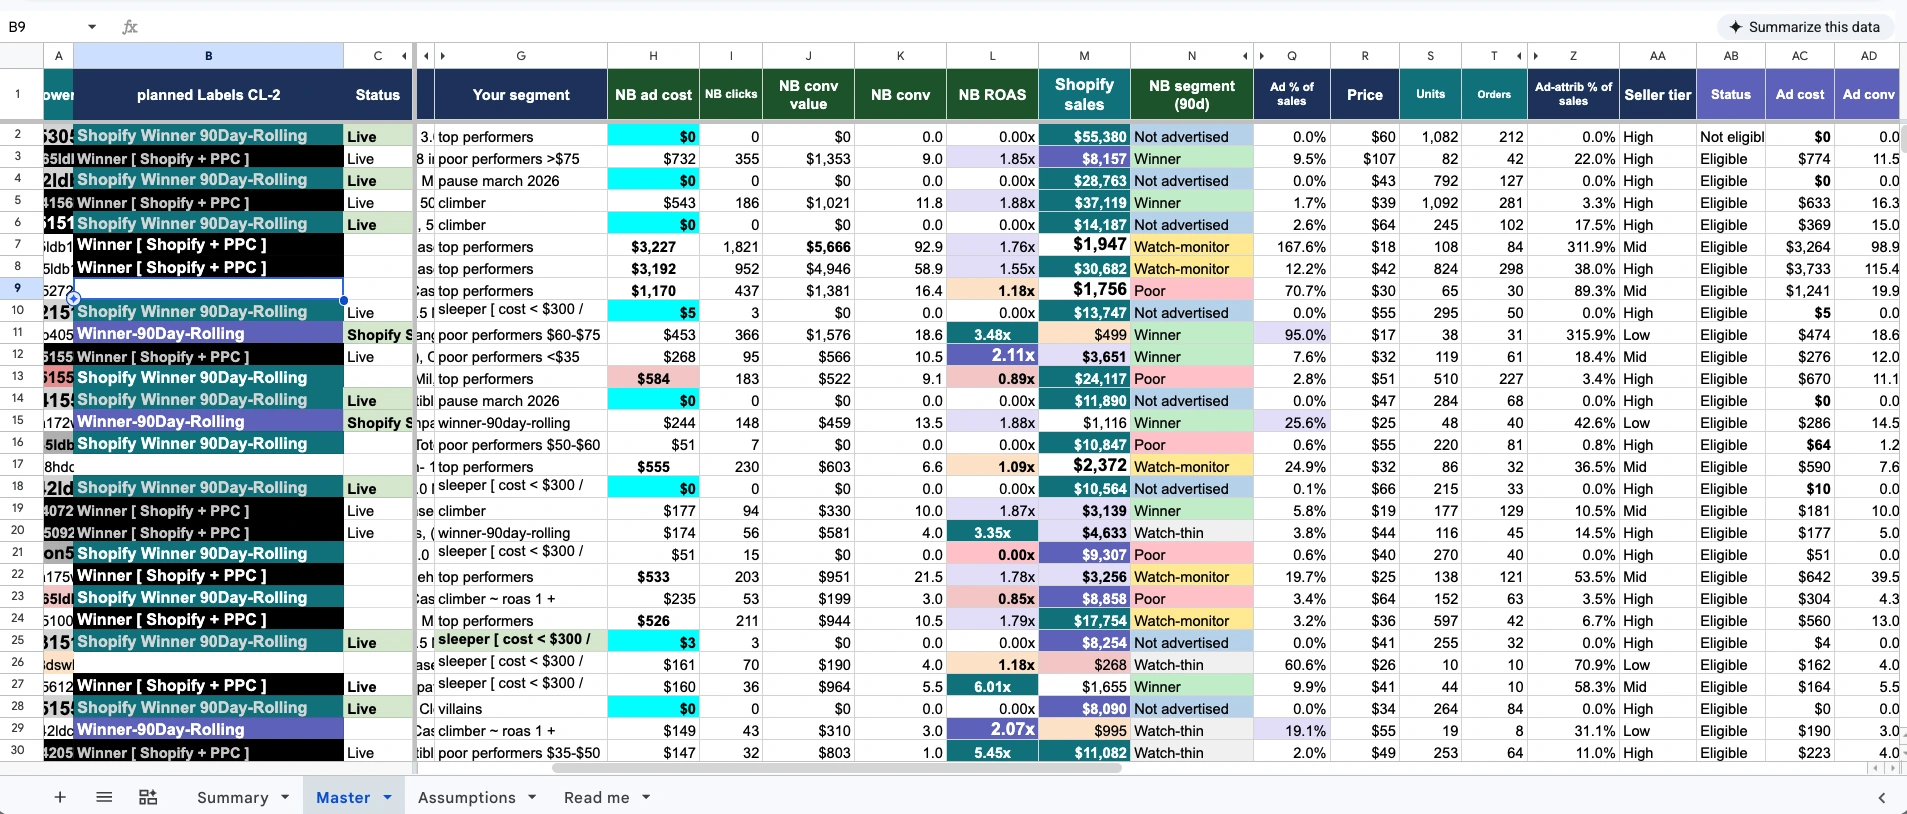
- Put the two columns side by side. This table is the whole audit.
- Flag the three misalignment patterns using the pattern table below (illustrative shares, not client data).
- Verify winners are durable. In JLM's four-season analysis, nearly 60% of one year's converters never converted again (JLM, 2026). Require a SKU to have converted in at least 2 of the last 4 same-season windows before calling it a winner.
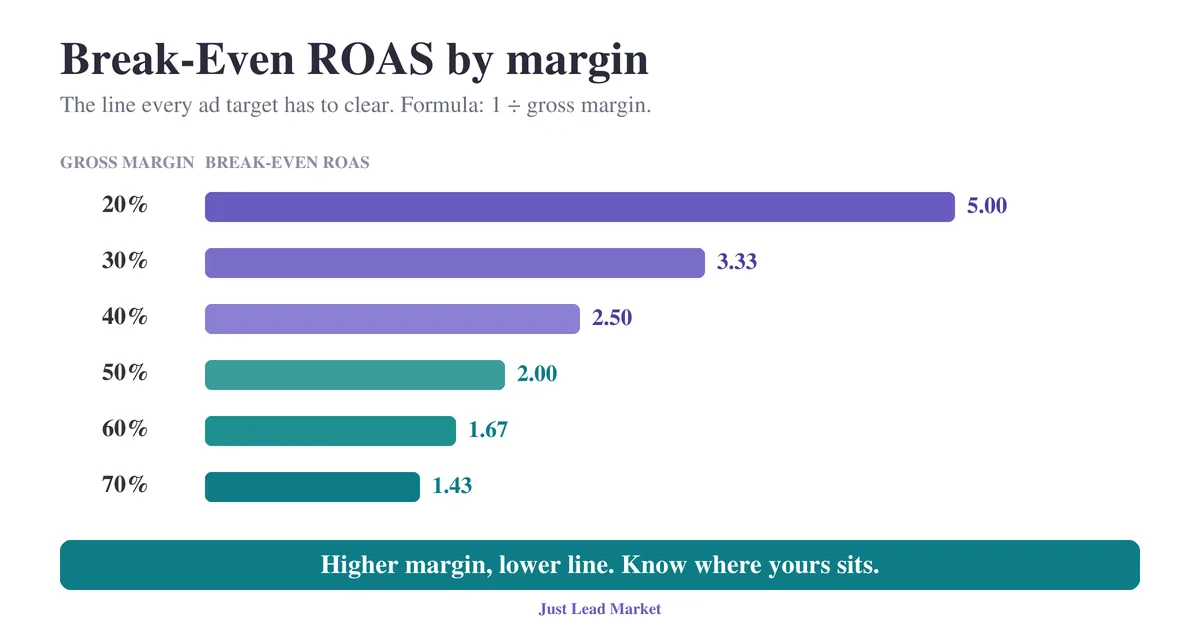
- Check margin, not just revenue. A high-revenue, low-margin SKU can deserve less spend than a mid-revenue, high-margin one. Use break-even ROAS per category: 1 divided by contribution margin.
- Act structurally, not by nudges (next section), then diarize the monthly re-run.
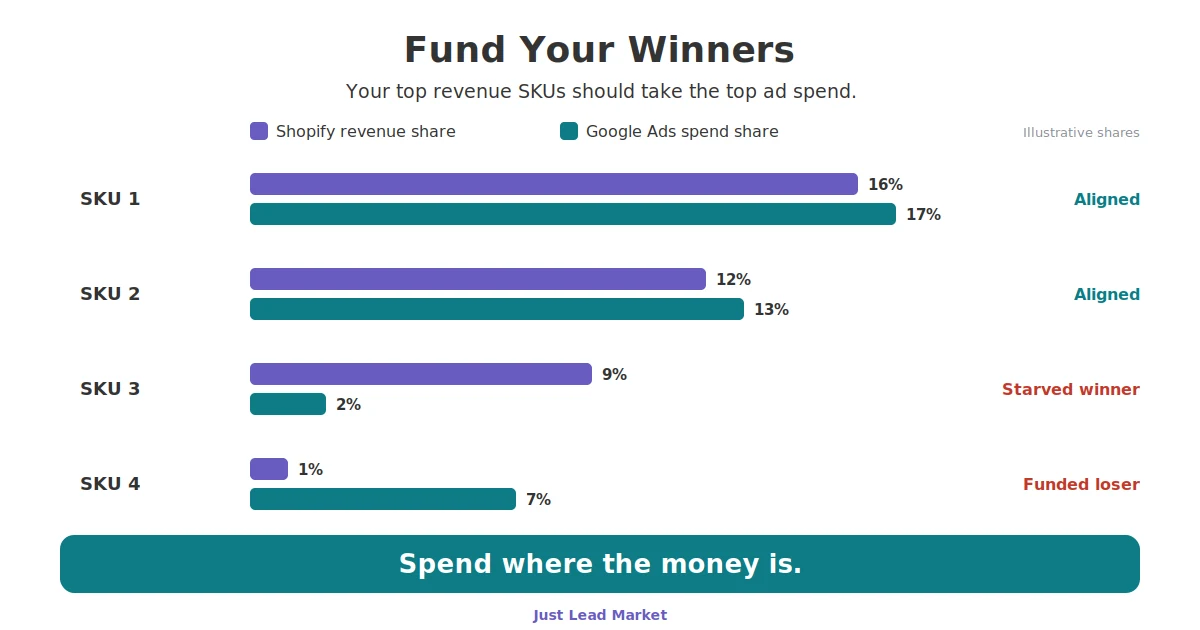
| Pattern | Revenue share | Spend share | Action |
|---|---|---|---|
| Aligned winner | 12% | 13% | Hold. Protect the budget. |
| Starved winner | 9% | 2% | Fund it. Dedicated label and budget. |
| Funded loser | 1% | 7% | Cap or exclude after a 14-day impression share check. |
| Doorway noise | 0% (never sold) | Real spend and credit | Roll up to base product before judging. |
How to Force Budget Onto Winners in Google Ads
Funding winners is a structure decision, not a bid nudge. Shared budgets and blended campaigns let the algorithm redistribute spend the moment you look away. Winners need their own container: a custom label, a dedicated campaign or asset group, and a budget that cannot leak to the long tail.
The mechanics JLM uses: tag proven winners with a custom label (for example winners-2026), give them a dedicated Shopping campaign or PMax asset group with its own budget, and set the ROAS target from break-even math rather than a round number. Make one structural change per two-to-three week window so you can read cause and effect. Before excluding winners from any existing campaign, run a 14-day impression share check so you are moving spend, not deleting it. And keep the tracking layer honest: Google Ads Enhanced Conversions for Shopify recovers a share of the browser-blocked purchases that would otherwise make winners look weaker than they are.
When a Winner Is Not a Winner
Three traps inflate a winner list.
- One-off converters: most of a single year's list will not repeat, which is why the 2-of-4-seasons rule exists.
- Doorway variants: in one JLM account, five variants showed about $3,000 of Google-credited revenue with zero lifetime Shopify sales; every dollar traced to sibling variants of the same base products (JLM client data, 2026). Judge at base product level or a working funnel entry gets cut.
- Margin blindness: revenue rank is not profit rank. Run the break-even ROAS check per category before scaling anything.
Quick Facts
- Google Ads reports conversions against the ad click date, not the purchase date (Google Ads Help, as of 2026).
- Shopify reports orders on their creation date in the store timezone (Shopify Help Center, as of 2026).
- Consent Mode v2 has been required for EEA ad personalization since March 2024 (Google). Safari ITP caps JavaScript-set cookies at 7 days (WebKit).
- In one JLM-managed seasonal account, about 35 winning SKUs produced roughly 75% of ad-attributed conversion value (JLM client data, 2026).
- The same account's top 20 Shopify revenue SKUs were confirmed to be taking the largest share of Google Ads spend, the aligned state this audit checks for (JLM client data, 2026).
- Nearly 60% of one year's converting SKUs never converted again in later seasons (JLM four-season analysis, 2026).
- Roughly 50% of rows in a Google Ads product report CSV can be $0-metric duplicates that must be removed before SKU analysis (JLM, 2026).
- Break-even ROAS equals 1 divided by contribution margin. A 40% margin means 2.5 is break-even.
KPIs to Watch
- Top-20 spend coverage (single success metric). The share of total Google Ads spend going to your top 20 Shopify revenue SKUs, checked monthly against those SKUs' revenue share. For proven, margin-positive winners, spend share should meet or exceed revenue share. A widening negative gap means winners are being starved.
- Starved-winner count. SKUs in the top revenue tier with spend share below half their revenue share. Target: zero, with a named reason for any exception (inventory, margin, seasonality).
Next Step
Run Step Zero once, then the 8-step alignment audit. If your top revenue SKUs are not taking the top spend, you have found money without raising budget. If you want it done for you, JLM will reconcile the data and run the alignment audit, and hand you the side-by-side sheet with every flag explained. Just Results, funded in the right place.