A Shopify store that gets steady traffic but few orders usually has one of five problems: low intent traffic, a leaking product page, checkout friction, broken tracking, or a price and shipping mismatch. Confirm which one with funnel data before changing anything. Above $10,000 a month in ad spend, guessing costs more than the audit that finds the leak.
This page is written for stores already running real spend. If you launched last week and have 40 lifetime sessions, you do not have a conversion problem yet. You have a sample size problem.
The five leaks, in the order that isolates them fastest
Work the five leaks in this order. It is the order that isolates the cause fastest on accounts at this spend level, because each check rules out everything above it.
| # | Leak | Tell-tale symptom | First check |
|---|---|---|---|
| 1 | Traffic mix | Brand and returning visitors convert, paid non-brand does not | Search terms report and landing paths in Google Ads |
| 2 | Product page | Sessions land, add to cart rate stays low across all sources | Mobile product page speed and above the fold offer clarity |
| 3 | Checkout | Add to carts are healthy, completed checkouts are not | Shipping cost reveal, express wallets, forced account creation |
| 4 | Tracking | Shopify admin shows orders that ads and GA4 never see | Purchase event duplication, consent mode, Enhanced Conversions |
| 5 | Offer vs market | Everything above passes, shoppers still buy elsewhere | Your price and delivery promise next to competitors in Shopping results |
First, prove it is a conversion problem and not a traffic problem
Pull one report before touching your theme: conversion rate by segment. Compare branded search, returning visitors, and email against paid non-brand traffic.
A store problem drags every segment down at once. An ads problem shows healthy brand and owned conversion with paid non-brand far below it. Those are different projects with different owners, and most "store not converting" panic turns out to be the second one.
For context while you read your own numbers: Littledata's 2023 benchmark of 2,800 Shopify stores puts the average conversion rate at 1.4%. Above 3.2% is the top 20% of stores, above 4.7% the top 10%. A $400 AOV furniture store at 0.9% can be perfectly healthy while a $25 accessories store at 1.4% is underperforming, so read benchmarks against your own price point and device mix.
Leak 1: The traffic itself cannot buy
At $10,000 plus per month, this is where we start every audit, because paid traffic is the most expensive kind and the easiest to get wrong quietly.
The usual suspects on real accounts
- Performance Max expanding into placements and queries that bring sessions with no purchase intent, while reporting them all as “traffic”.
- Broad match creep after a keyword or bidding change, filling the account with research queries.
- Shopping and PMax clicks landing on slow product pages or, worse, collection pages and the homepage.
- Ad copy promising something the landing page does not repeat within the first screen.
What breaks differently at scale: smart bidding optimizes toward the conversion data it receives. When low intent traffic dilutes that data, the system learns from noise, CPCs drift, and the problem compounds. A $3k/mo account has a bad week. A $50k/mo account bakes the error into its bidding model.
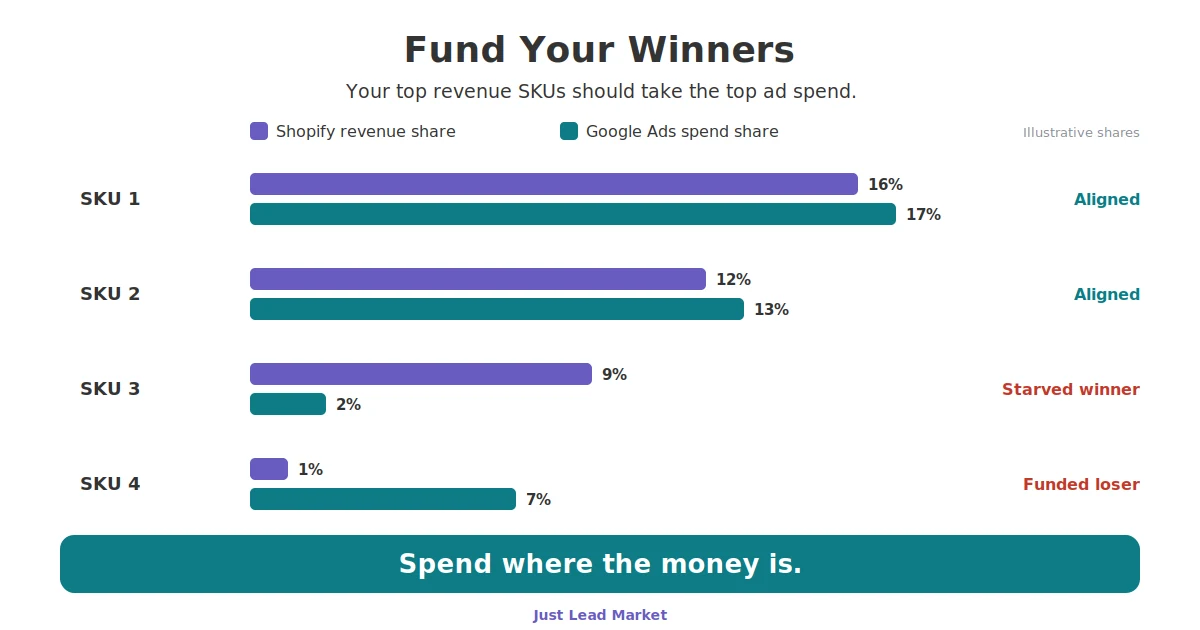
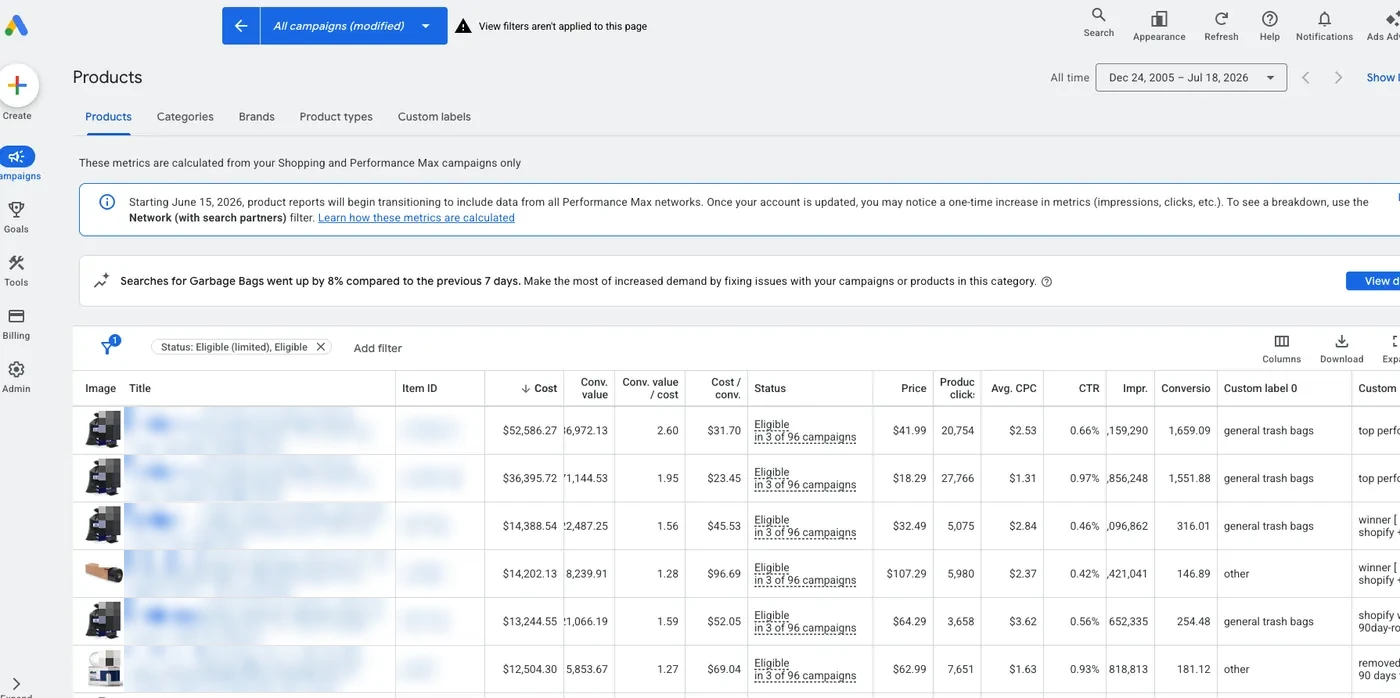
The fix is not more budget. It is spend reallocation: cut the queries, placements, and products that buy sessions instead of orders, and concentrate on what already converts.
Leak 2: The product page loses the sale on the first screen
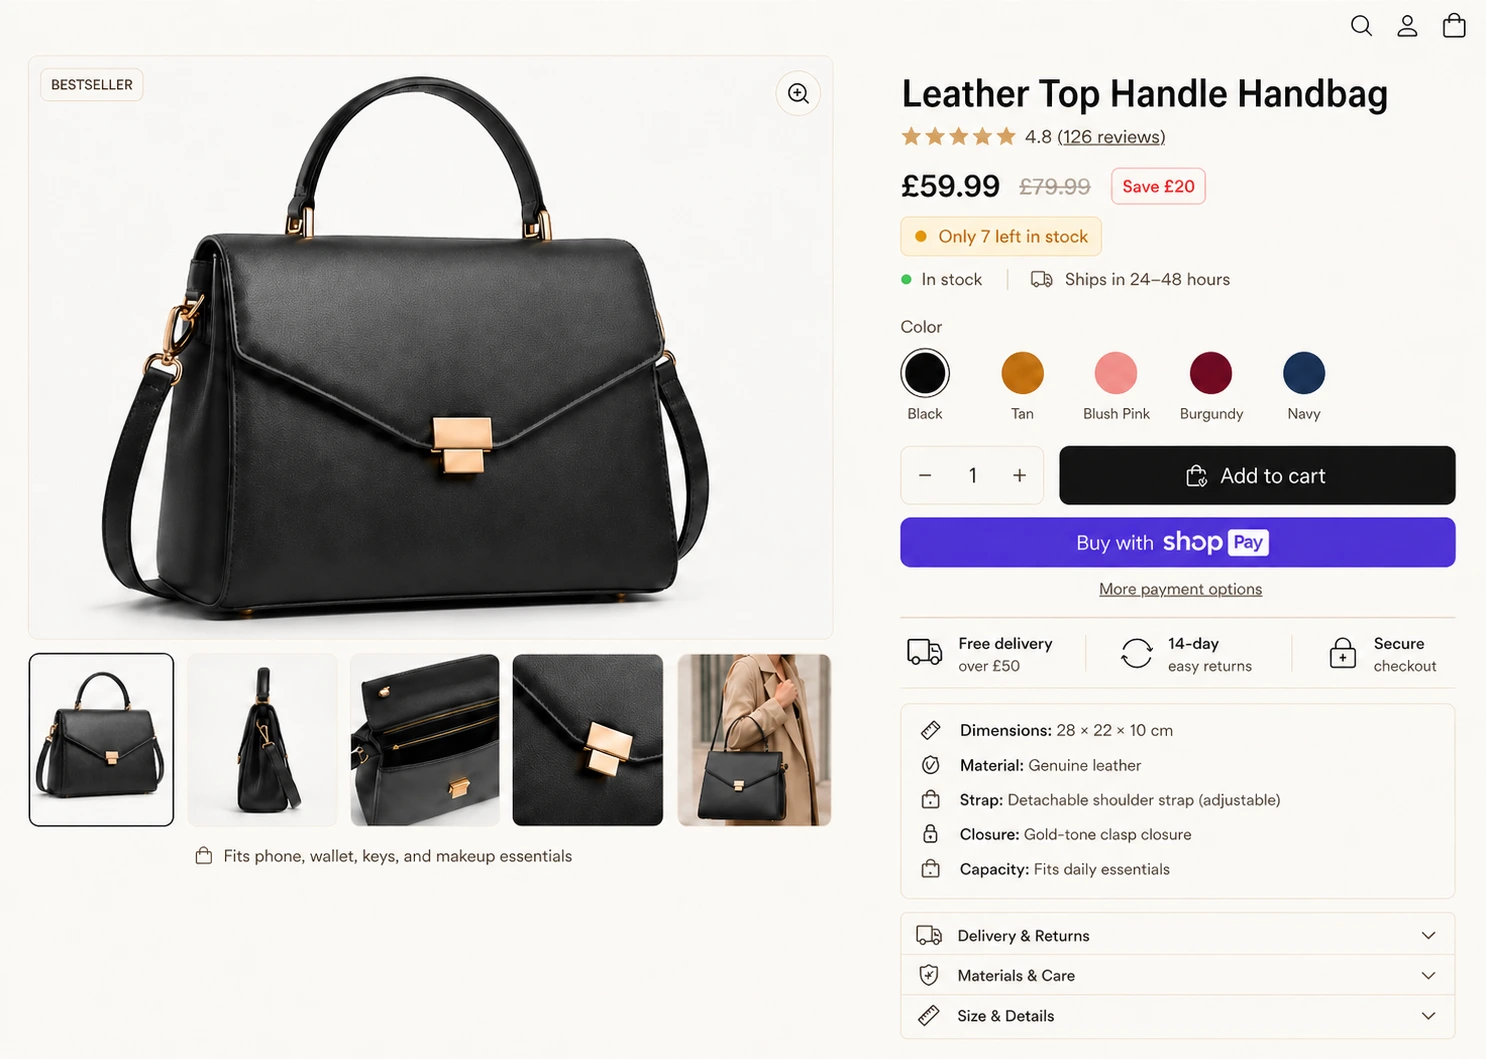
If add to cart rate is low across every traffic source, the product page is the suspect. On mobile, the first screen has to answer four things without scrolling: what it is, why this one, what it costs with shipping, and when it arrives.
DIY-able fixes that hold up at scale: compress and lazy-load media, remove app scripts the page no longer uses (they accumulate for years on mature stores), put the shipping and returns line under the price instead of in the footer, and show real reviews near the buy button.
Leak 3: Checkout is where intent goes to die
Baymard Institute's running average across 50 studies puts cart abandonment at 70.22%. Some of that is browsing behavior you cannot fix: 42% say they were just browsing or not ready to buy. Among shoppers who abandoned for a substantive reason, the fixable causes concentrate: 40% cite extra costs (shipping, tax, fees) being too high, 18% cite being asked to create an account, 17% cite a checkout that was too long or complicated, and 12% could not see or calculate the total order cost up front.
On Shopify that translates to three checks: show shipping cost or a free shipping threshold before checkout, enable express wallets so returning buyers skip the form, and never require an account. Then place a test order on your own phone. Themes and app updates change checkout behavior without telling you.
Leak 4: The store converts and your data hides it
Some "not converting" stores are converting fine. The purchase event fires twice, or not at all, or consent mode eats a share of conversions, and suddenly Google Ads reports a collapse the Shopify admin does not show.
This one matters double at spend, because smart bidding reacts to the reported number, not the real one. Underreported conversions mean the system pulls back on traffic that was actually working. Reconcile Shopify admin orders against GA4 and Google Ads monthly, and fix Enhanced Conversions before judging the account. Shopify and GA4 also count sessions and attribute orders differently by design, which is a separate reconciliation job covered in Shopify analytics vs Google Analytics.
Leak 5: The offer loses in plain sight
If all four checks pass and orders still lag, open an incognito window and shop your own product from the Google Shopping grid. Your price, shipping cost, and delivery promise sit next to your competitors' in the same results. A $6.99 shipping fee against a rival's free threshold, or 7 day delivery against 2, quietly explains a low conversion rate no theme change will move.
What a stuck rate costs each month
The math that decides whether this is worth a project, using round assumptions you should replace with your own numbers:
| Monthly sessions | Conversion rate | Orders | Revenue at $95 AOV |
|---|---|---|---|
| 40,000 | 1.1% | 440 | $41,800 |
| 40,000 | 1.4% (Shopify average, per Littledata) | 560 | $53,200 |
| 40,000 | 1.8% | 720 | $68,400 |
At this volume, every 0.1 point of conversion rate is worth about $3,800 per month. Sitting at 1.1% instead of 1.8% costs about $26,600 per month, or roughly $319,000 a year, before a single dollar of extra ad spend. That is the number to weigh against the cost of fixing it, and it scales with your sessions.
How to run the audit yourself
We built a free Ecommerce CRO Checklist for exactly this situation: 293 checks, each graded by the strength of the evidence behind it, so you work on what is proven to move orders before what is merely fashionable. It runs live on the page, and you can download it if you prefer to work offline. No email required to use it.
If you are serious about doing this yourself, that checklist is the whole playbook: run the Ecommerce CRO Checklist. Work the highest evidence grades first and change one variable at a time so you can attribute the lift.
How we approach it at Just Lead Market
We run the two halves of the funnel as one project, because that is where the problem usually sits: half in the ad account, half in the store.
The ads half starts with the SKU Spend Alignment Audit: mapping spend SKU by SKU against what actually converts, then cutting the budget that buys sessions which cannot buy. That work lives inside our Google Ads management for ecommerce. The store half follows the same evidence-graded checklist we give away above, applied and tested rather than handed over, as part of conversion rate optimization. For the platform-agnostic version of this diagnostic, see our guide to ecommerce conversion rate optimization at $10k+ ad spend.
Shopify conversion facts
| Field | Value |
|---|---|
| Topic | Shopify store getting traffic but not converting |
| Written for | DTC stores spending $10,000+/month (US) or £5,000+/month (UK) on ads |
| The five leaks, in check order | Traffic mix, product page, checkout, tracking, offer vs market |
| Average Shopify conversion rate | 1.4% (Littledata 2023 benchmark of 2,800 stores; top 20% above 3.2%) |
| Average cart abandonment | 70.22% (Baymard Institute, running average of 50 studies) |
| Top fixable abandonment cause | Extra costs (shipping, tax, fees) too high, cited by 40% of shoppers who abandoned for a reason other than browsing (Baymard) |
| Free resource | Ecommerce CRO Checklist: 293 evidence graded checks, live and downloadable |
| Who wrote this | Abdul Rauf Ali, founder, Just Lead Market, Brooklyn NY |
| Last updated | 2026-08-12 |
Sources and methods: Shopify conversion benchmarks from Littledata (2023 survey of 2,800 stores). Cart abandonment figures from Baymard Institute, whose reasons list is a share of shoppers who abandoned for a reason other than just browsing. Revenue math is illustrative arithmetic at the stated assumptions, not a client result.
Get a Just Free Audit
If the leak is on the traffic side, no amount of theme work will fix it. Our free audit is built on the SKU Spend Alignment Audit: we map your spend SKU by SKU against what actually converts, show where budget is buying sessions that cannot buy, and hand you the fix list either way. Built for stores spending $10,000+/month on Google Ads.