Ecommerce conversion rate optimization is the process of raising the percentage of sessions that end in a purchase, and the revenue each session produces. For stores spending $10,000 or more per month on ads, that means fixing the specific pages that carry paid traffic first, because every gain there compounds against money you are already spending.
Some sources call it ecommerce conversion optimization or ecommerce CRO. Same work. This page covers how to confirm you actually have a conversion problem, the six causes that explain most low rates, what changes at real spend levels, and how to run the audit yourself with our free checklist.
First, confirm the problem is real
A blended conversion rate hides more than it shows. Before touching the site, split the number and find out where the leak actually is. On Shopify specifically, the same diagnostic runs against five named leaks in a fixed order: see Shopify store not converting.
| Symptom | Where to look | What it usually means |
|---|---|---|
| Blended rate looks fine, paid rate is falling | GA4: session conversion rate by default channel group | Traffic mix shifted. Scaling pulled in broader, colder queries |
| High add to cart, low checkout completion | Shopify: online store conversion funnel | Checkout friction. Surprise costs, forced accounts, missing payment options |
| Mobile converts far below desktop | GA4: conversion rate by device category | Mobile speed or layout problems, not "mobile users do not buy" |
| One landing page absorbs most spend with a weak rate | Google Ads: landing pages report | The ad promise and the page content do not match |
| Rate dropped suddenly on a specific date | GA4 plus your site change history | A tracking break or site change, not shopper behavior |
| Sessions up, orders flat | Google Ads: search terms report | You bought more traffic below purchase intent |
On benchmarks, be careful which number you compare against, because the popular ones do not measure the same thing.
Littledata put the average Shopify conversion rate at 1.4%, from 2,800 Shopify stores on 2023 data it has not refreshed since. Dynamic Yield's live benchmark tool showed a 2.74% global average when we checked it on July 30, 2026, with EMEA at 2.89%, the Americas at 2.69%, and APAC well below at 1.58%. Shopify's own guidance calls 3% "generally considered a good conversion rate" for ecommerce, while its more recent writing puts global averages at 2 to 3% and declines to name a universal benchmark.
Read those as three different instruments rather than one contradiction. Littledata's is one vendor's Shopify client base from three years ago. Dynamic Yield's counts purchases per visitor rather than per session, which runs higher than the session-based rate GA4 and Shopify will show you, and its panel is enterprise brands that already bought a personalization product. Shopify's 3% is a rule of thumb with no published sample behind it. Stacking them as if they measured the same population with the same denominator is the actual mistake.
So segment first. Your rate by device, by channel, by landing page, against your own vertical and price band. That comparison tells you something. A global average does not. A $2,000 AOV furniture store at 0.9% can be healthier than a $30 AOV accessories store at 3%.
The six causes that explain most low conversion rates
- The ad promise and the page do not match. A shopper clicks an ad for "solid oak king bed frames under $900" and lands on a general bedroom furniture collection. Intent leaks out in the first five seconds. This is the cheapest cause to confirm: open your top spending ads next to their landing pages and read them as a stranger would. When paid traffic hits this kind of gap, the ad account looks weak even when targeting is fine, and teams end up rebuilding campaigns to fix a landing page problem.
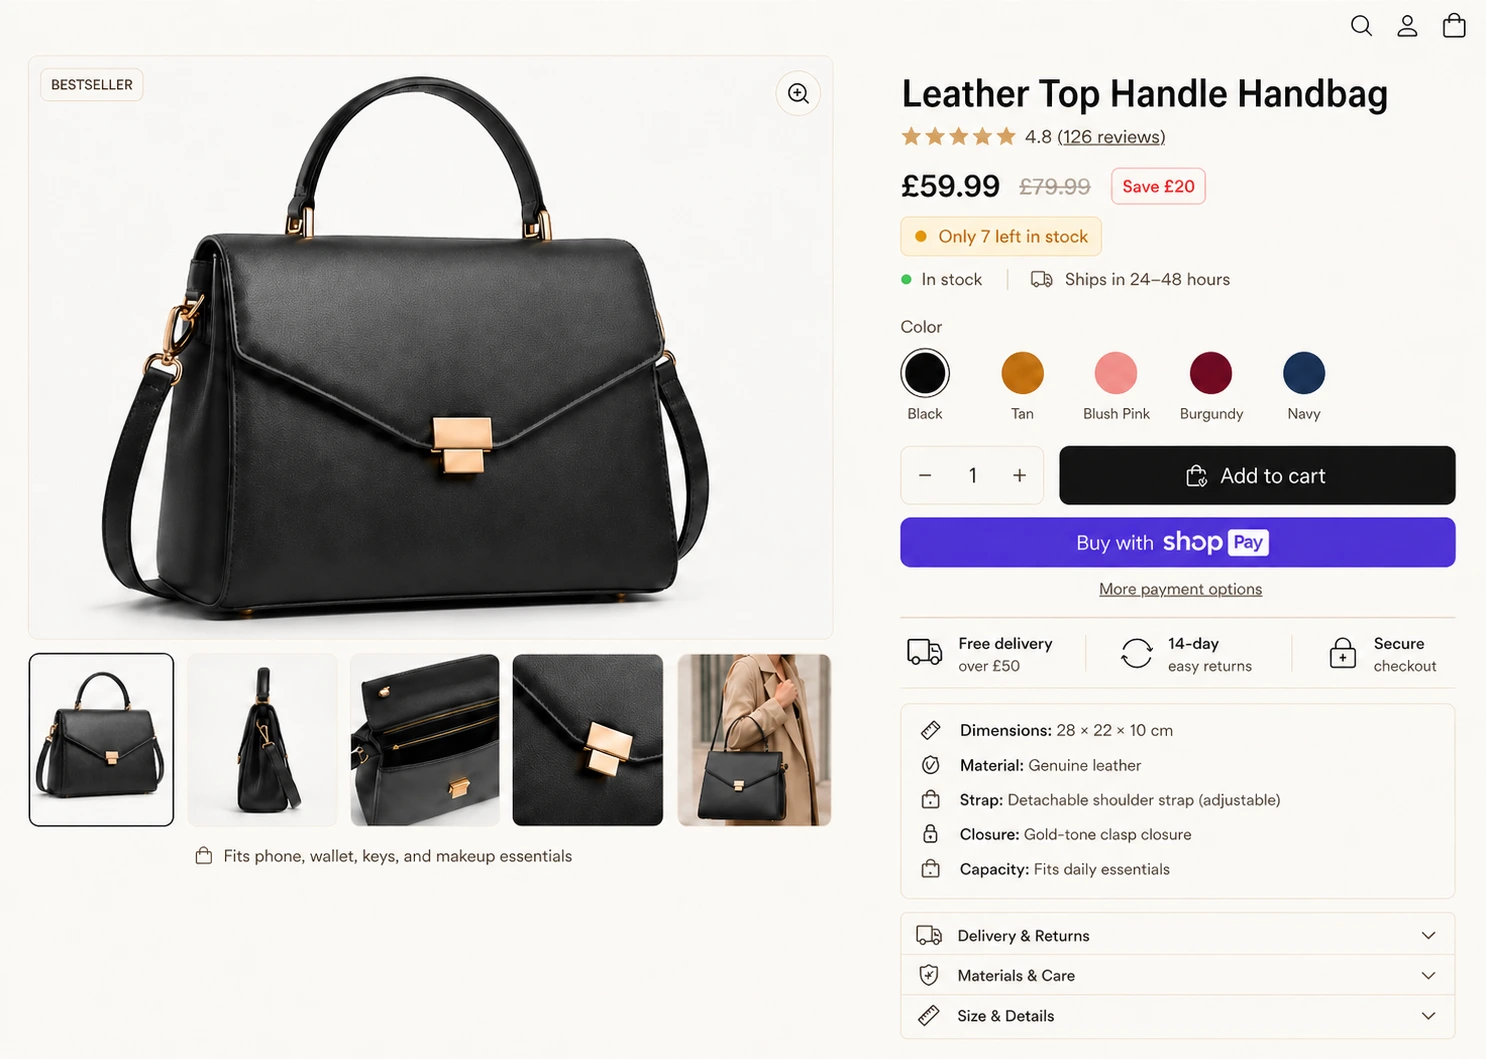
- Product page gaps. Shipping cost and delivery time missing above the fold. Thin or slow images. No size, spec, or compatibility answers. Reviews buried or absent near the buy button. Shoppers do not email to ask. They leave.
- Checkout friction. Baymard Institute keeps a running average of published cart abandonment studies and puts it at 70.22%, across 50 studies spanning 2006 to 2025. Treat that as a long-run industry aggregate, not as your number. The more useful figure is the reason list from Baymard's own survey of US shoppers: 40% of those who abandoned a cart, setting aside the ones who were only browsing, said the extra costs of shipping, tax, and fees were too high. Baymard also estimates the average large-sized ecommerce site could gain roughly a 35% increase in conversion rate through better checkout design alone, a projection from its testing of large US and EU retailers rather than a promise for any one store. The direction holds at any size: every surprise at checkout is paid for in orders.
- Speed and mobile parity. Test your top three landing pages on a mid-range phone over mobile data, not on office wifi. If the hero image takes four seconds, nothing below it matters. Mobile usually carries most sessions and converts at a fraction of desktop, so small mobile fixes move the blended number more than desktop polish does.
- Trust gaps. Unclear returns policy, no visible contact route, missing payment marks, no company address. Each one is a small tax on every session, and they compound at higher price points where the shopper's risk is real money.
- Broken measurement. Sometimes the rate is fine and the tracking is lying. Duplicate purchase events inflate it. Consent mode losses and misfiring pixels deflate it. Confirm the purchase event fires once per order and reconciles against Shopify order counts before you redesign anything. Fixing a site because of a broken tag wastes a quarter.
Fixes that hold up at $10,000 per month and above
Prioritize by spend, not by opinion. Most stores have three to five pages that carry the bulk of ad spend and revenue. We classify pages as Hero, Sidekick, or Ghost by contribution margin, and conversion work goes to Heroes first. A 0.3 point gain on the page that takes 40% of your spend beats a full redesign of pages nobody lands on.
Run the test math before you run tests. To detect a move from 2.0% to 2.4% at standard settings (95% confidence, 80% power), you need about 21,000 sessions per variant, so roughly 42,000 to run the test at all. The example store further down this page buys 20,000 paid sessions a month, which puts one conclusive test at about two months. Most stores have that kind of volume on two or three pages at most. Everywhere else, A/B tests never conclude and just delay fixes. On lower traffic pages, ship changes backed by documented evidence instead of running tests that cannot reach significance. That is exactly what a weighted checklist is for.
Fix the ad-to-page path before the template. At $10k+ per month, the fastest wins usually sit between the ad and the page, not inside the theme. Tighten the match between query, ad, and landing page for your top spenders. This is where conversion work and Google Ads management stop being separate jobs: a higher conversion value per click raises what you can bid at the same target, which buys back impression share. The gain shows up twice.
Know when the fix is a build. Some fixes are copy and settings. Others are theme surgery: restructuring a product page template, cutting render-blocking scripts, rebuilding a slow collection layout. If the checklist keeps flagging items your current setup cannot change, that is a job for a Shopify development team, and it is cheaper than dragging a structural problem through another quarter of ad spend.
What breaks differently at scale. As spend scales, marginal traffic quality falls. Broader queries, colder audiences. Your blended rate can compress even while the site improves. Separate the mix effect from the site effect before concluding the store got worse: compare conversion rate on your original core queries against the new incremental ones. Scaling problems and site problems have different fixes, and confusing them is expensive in both directions.
What a stuck rate costs each month
Run your own numbers, but here is the shape at a realistic spend level. Example arithmetic, not a promise, and it treats one paid click as one session.
| Today | After a 0.4 point lift | |
|---|---|---|
| Monthly ad spend | $30,000 | $30,000 |
| Average CPC | $1.50 | $1.50 |
| Paid sessions | 20,000 | 20,000 |
| Conversion rate | 2.0% | 2.4% |
| Orders | 400 | 480 |
| Revenue at $150 AOV | $60,000 | $72,000 |
| ROAS | 2.0 | 2.4 |
The gap is $12,000 per month on identical spend, about $144,000 a year if the lift holds. Swap in your own CPC and AOV and the shape holds. This is also the honest way to decide whether to do the work yourself or pay for help: whichever route closes the gap faster wins, because the gap bills you monthly either way.
How we run it at Just Lead Market
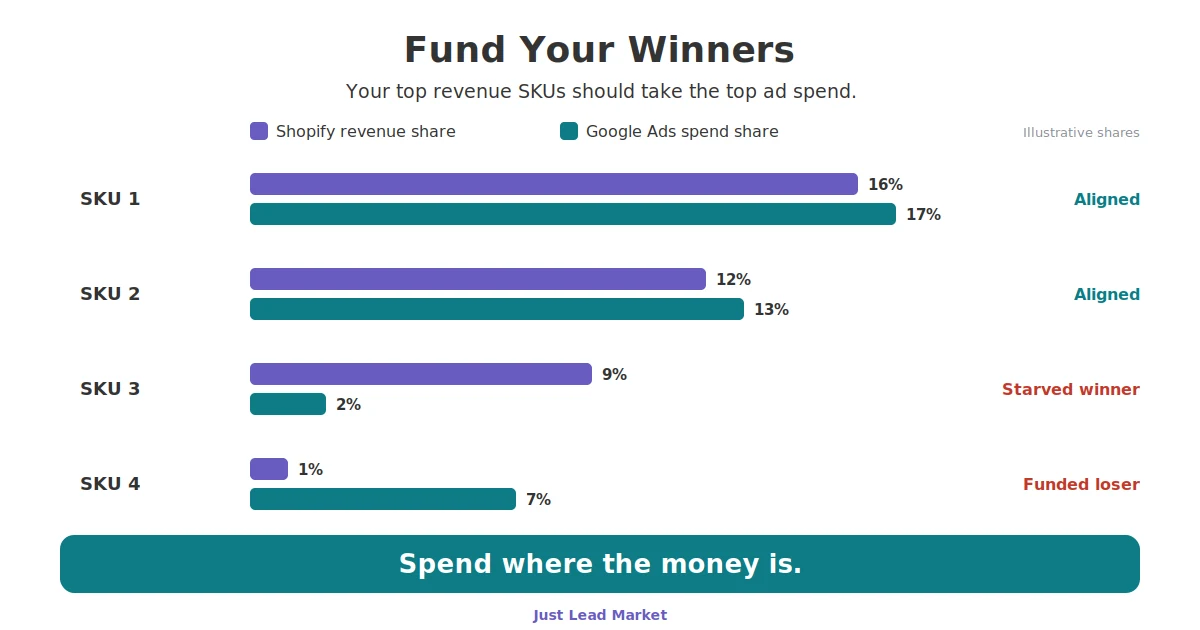
We start from spend, not from the homepage. The SKU Spend Alignment Audit traces where ad money actually sits, SKU by SKU and page by page, against what each one returns. That tells us which pages deserve conversion work at all. Then we run those pages through the same checklist we give away free.
I built our 293-point ecommerce CRO checklist because most CRO advice is a listicle with no scoring and no order of operations. Ours runs 293 checks across 10 pages, from the general site experience through the thank you page, including one page of checks just for paid traffic readiness and one for popular tactics that are now illegal in the UK and the US. Every check is graded Critical, High, or Standard by the evidence behind it, and the weighting follows: Critical counts 3x a Standard check, High counts 2x. The coverage score updates as you tick, and the Fix First panel collects every unticked Critical check so the order of work is decided for you. It runs live on our site, free, no sign-up.
If you have a spare afternoon and someone who owns the fix list, the checklist alone will surface real problems. I mean that. The point where DIY stops making sense is in the table above: when the monthly cost of the gap passes the cost of help, speed matters more than the fee. The same page fixes also lift organic conversion, which is why this work sits next to what we do as an ecommerce SEO agency: the page that converts paid clicks is the page that converts search clicks.
Ecommerce CRO facts
| Field | Value |
|---|---|
| Topic | Ecommerce conversion rate optimization (also written ecommerce CRO) |
| Who this is for | DTC stores spending $10,000+/month on Google Ads |
| Platforms covered | Shopify, BigCommerce, Google Ads, GA4 |
| Free tool | 293-check CRO checklist: 10 pages, Critical / High / Standard evidence grades, 3x / 2x / 1x weighted coverage score, Fix First panel |
| Benchmark sources on this page | Baymard Institute, Dynamic Yield, Littledata, Shopify |
| Cart abandonment average | 70.22% across 50 studies published 2006 to 2025 (Baymard Institute) |
| Related services | Conversion rate optimization, ecommerce SEO, Google Ads management, Shopify development |
| Last updated | 2026-07-30 |
Get a Just Free Audit
We trace your ad spend to the SKUs and pages that carry it, then run the conversion checks on the pages that matter. You get the leak list ranked by revenue impact, whether or not we ever work together.
Built for stores spending $10,000+/month on Google Ads.