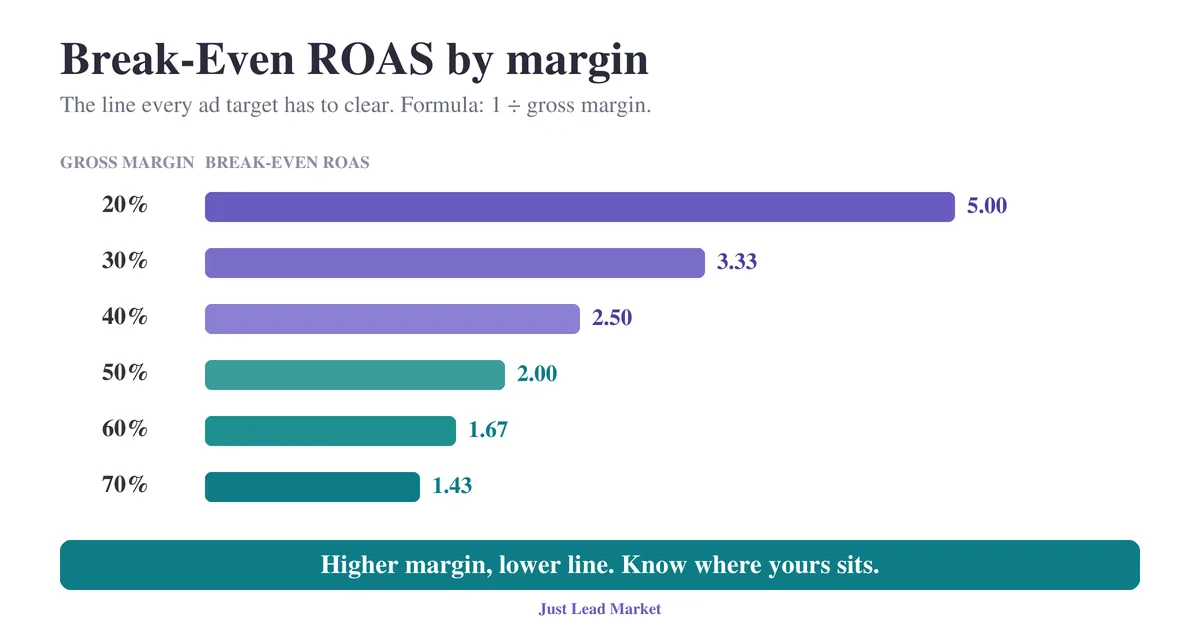
Break-even ROAS is the return on ad spend where an order's revenue exactly covers its product cost, fulfillment cost, and the ad spend that produced it. The formula: break-even ROAS = 1 ÷ gross margin. A store with a 40% gross margin breaks even at 2.5. Any campaign returning less than that loses money on every order it wins.
Most ROAS targets are folklore. Someone heard 3x is fine, or 4x is good, and that number became the goal. Nobody checked it against the store's margin. That is how accounts spend months hitting target while the P&L quietly bleeds.
This page gives you the formula, the margin table, the 15-minute check to see where your account sits, and how to set a target ROAS above the line. It is written for stores already spending $10,000 or more per month on ads. If you are setting up your first campaign, this is not the page for you yet.
The break-even ROAS formula
Break-even ROAS = 1 ÷ gross margin.
Gross margin is gross profit per order divided by average order value. Gross profit per order is AOV minus landed cost: the product cost plus everything it takes to get the order out the door, including shipping you subsidize, packaging, and payment processing fees.
Worked example. A $120 order carries $55 of product and shipping cost. Gross profit per order is $65, so gross margin is 54%. Break-even ROAS is 1 ÷ 0.54, which is about 1.85. Every $1 of ad spend on that product must bring back $1.85 in revenue just to break even.
You will also see it written as breakeven ROAS or BEROAS. Same number.
The companion metric is break-even CPA: the most you can pay to acquire one order before that order loses money. Break-even CPA = AOV × gross margin, which is just gross profit per order.
Here is the full table. Find your margin, read your line.
| Gross margin | Break-even ROAS | Break-even CPA (per $100 AOV) |
|---|---|---|
| 20% | 5.00 | $20 |
| 25% | 4.00 | $25 |
| 30% | 3.33 | $30 |
| 35% | 2.86 | $35 |
| 40% | 2.50 | $40 |
| 45% | 2.22 | $45 |
| 50% | 2.00 | $50 |
| 55% | 1.82 | $55 |
| 60% | 1.67 | $60 |
| 70% | 1.43 | $70 |
One Google Ads translation note: the platform takes target ROAS as a percentage, not a multiple. A 2.5 break-even ROAS corresponds to a 250% entry in the target ROAS field.
If you would rather not do the arithmetic, we built a free break-even ROAS calculator, the Ad Profit Check. Enter last month's revenue, total ad spend, AOV, product cost, and shipping cost per order. It returns your current MER, gross margin, break-even ROAS, break-even CPA, and the revenue your target implies. It runs in your browser, stores nothing, and takes about a minute.
How to confirm you have a break-even problem
Symptoms first:
- Your ROAS target exists, but nobody can say what margin math produced it.
- The account "hits target" most months, yet contribution profit from paid is flat or negative.
- Finance and marketing disagree about whether the ads work.
- Thin-margin products get the same target as your best sellers.
The 15-minute check:
- Pull last month's revenue and total ad spend. Divide revenue by spend. That is your blended MER.
- Compute landed cost for a typical order: product, subsidized shipping, packaging, payment fees. Subtract from AOV, divide by AOV. That is your real gross margin.
- Divide 1 by that margin. That is your break-even line.
- Compare. Blended MER below the line means the account as a whole is paying to lose money. Blended MER above the line means check campaign by campaign, because a healthy blend can hide individual campaigns running below it.
Once you have the line, size the spend below the line by query, product and campaign type, so you know how much of the budget it covers.
Why accounts end up below break-even
- The target came from folklore, not margin. A benchmark from a podcast, a previous job, or another store's screenshot. Benchmarks skip the only input that matters, which is your margin.
- Margin was computed on product cost only. COGS gets counted. Shipping subsidies, packaging, and the roughly 3% payment processing fee do not. Returns get skipped entirely. The NRF and Happy Returns 2025 report projects that 19.3% of US online sales will be returned in 2025 (NRF, October 2025). Google Ads does not subtract returns from reported conversion value unless you adjust for them, so a reported 2.8 ROAS with a 19% return rate is closer to a 2.27 on banked revenue. If your break-even is 2.5, that account looks profitable and is not.
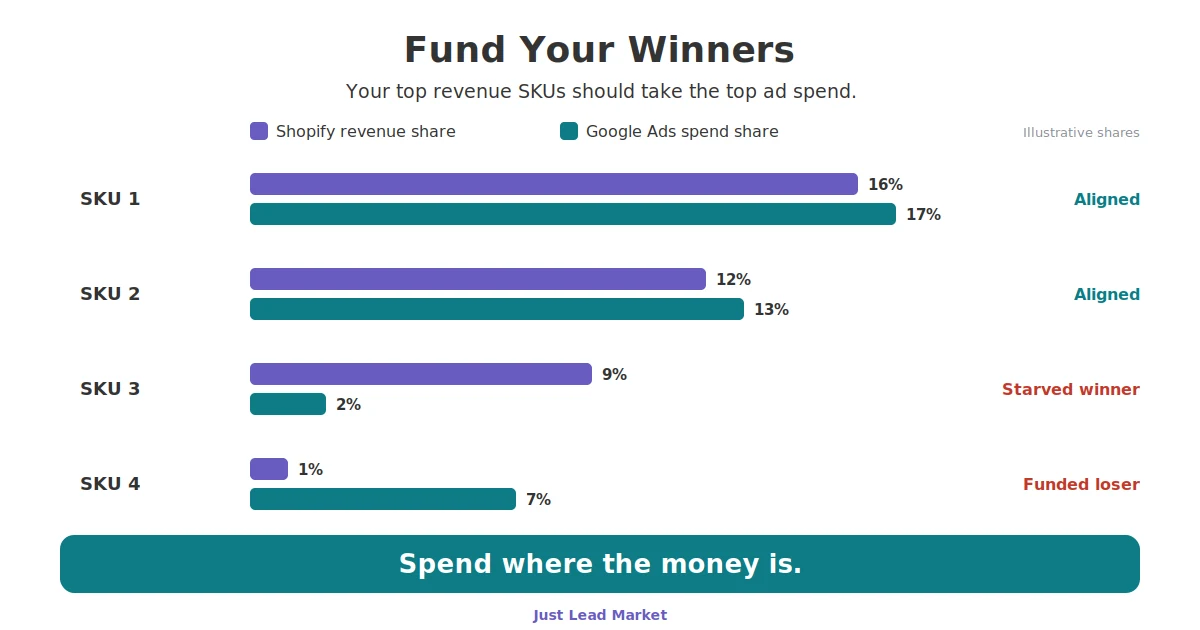
- One blended target across products with different margins. A 55% margin hero breaks even at 1.8. A 25% margin accessory needs 4.0. A single 3.0 target across both overspends on the accessory and starves the hero.
- Platform revenue is not banked revenue. Attributed conversion value includes modeled and assisted revenue depending on settings, and it never saw your refunds. The gap between Google Ads revenue and Shopify revenue is normal. Pretending they are the same number is not.
- Scaling past marginal break-even. As spend rises, the return on the next dollar falls. An account can hold a blended 2.9 while its last $5,000 of monthly spend runs at 1.9. Blended above the line, marginal below it, and every incremental dollar loses money.
Fixes for accounts at $10k+/month
Most advice on how to increase ROAS starts with creative and bids. Start with margin instead.
Recompute landed margin, then set the floor. Use real landed cost per order, returns included, per product category, not one storewide average. Your break-even lines come from this. Everything downstream depends on it being honest.
Set target ROAS from profit goals, not benchmarks. Decide the profit you want per order, then back into the target. A 40% margin store wanting $15 net on a $100 order can afford $25 of ad cost, which means a 4.0 target, entered as 400%. Break-even is the floor, never the target.
Segment campaigns by margin band. Group products so each campaign's target reflects the margin of what it sells. In Shopping and Performance Max, custom labels carry the margin band into the feed so budgets follow profit, not just revenue.
Watch marginal, not just blended. When you raise budgets, compare the return on the added spend against the line, not the account average.
Honest note on DIY. The math on this page is fully DIY at any spend level, and the calculator makes it a one-minute job. Where DIY stops making sense is execution across a large catalog: margin-banded feed segmentation, per-campaign targets, and value rules on accounts spending $50,000 or more per month. That is structural work, and getting it wrong at that spend level is expensive.
What running below break-even actually costs
Take a store spending $30,000 per month at a 40% gross margin. Break-even ROAS is 2.5.
| Blended ROAS | Monthly revenue | Gross profit (40%) | Net after ad spend |
|---|---|---|---|
| 2.2 | $66,000 | $26,400 | -$3,600 |
| 2.5 | $75,000 | $30,000 | $0 |
| 2.8 | $84,000 | $33,600 | +$3,600 |
At 2.2, the account loses $3,600 a month, $43,200 a year, while the dashboard shows a number that sounds respectable. The move from 2.2 to 2.8 on the same budget is a $7,200 monthly swing. That is the cost of not knowing where your line is.
How JLM handles it: the BE-ROAS Budget Map
The BE-ROAS Budget Map is how we apply everything above to a real account. We compute break-even ROAS per margin band across the catalog, then map every campaign's budget and target against its band's line instead of one blended account target. High-margin products get room to scale because their line is low. Thin-margin products get capped or cut because their line is high. Budget flows toward the products that clear their own line by the widest gap, and the account stops averaging its way into losses.
We built the Ad Profit Check for the same reason. Before any budget conversation, the store owner and I need to agree on one number: where break-even sits. The calculator gets us there in a minute instead of a spreadsheet session, and it is free because the argument it settles is the foundation of everything else we do on Google Ads accounts.
Break-even ROAS facts
| Field | Value |
|---|---|
| Topic | Break-even ROAS (also written breakeven ROAS or BEROAS) |
| Formula | Break-even ROAS = 1 ÷ gross margin |
| Companion metric | Break-even CPA = AOV × gross margin |
| Example | 40% gross margin gives a 2.5 break-even ROAS |
| Applies to | Google Ads, Performance Max, Shopping, Meta, any paid channel |
| Free tool | Ad Profit Check calculator at justleadmarket.com |
| Written for | DTC stores spending $10,000+/month on ads |
| Last updated | 2026-07-24 |
Find out where your account sits
Get a Google Ads account audit built on the SKU Spend Alignment Audit. We map your spend against your real break-even lines, product by product, and show you where budget is flowing below the line. You see the map before you decide anything.
Built for stores spending $10,000+/month on Google Ads.