Pull five reports for the last 90 days: search terms, the Products tab, Performance Max channel performance, the network split, and change history. Tag every row that returned zero, less than it cost, or less than your break-even ROAS. Add that spend into one ledger and divide by total spend. That share is your wasted ad spend.
This page is for stores spending $10,000 a month or more on Google Ads in the US, or £5,000 or more in the UK, that suspect part of the budget is going nowhere and want a number for it. Not a list of nine leaks. A number, built from your own reports, with each dollar assigned to a query, a product or a campaign type so the fix is obvious from the row it sits in.
The pages that rank for this question list leak types and stop: broad match, Display expansion, auto-applied recommendations, Performance Max spreading budget across weak products. A list says where waste can hide, not whether your account has $600 of it or $6,000. Only the second figure changes what you do next.
Two limits before the method. Some spend cannot be measured at the query level at all, because Google omits low-volume search terms from the report, so the ledger carries an unattributed line rather than pretending. And waste is only definable against a line, so you need your break-even ROAS before you start. If you do not have it, the break-even ROAS guide gets you there in 15 minutes.
What counts as wasted ad spend in Google Ads: three lines, not one
"Wasted spend" gets used for everything from a bot click to a campaign at 2.8x that should be at 3.0x. Those are not the same problem and they do not get the same fix, so the ledger uses three lines.
| Line | Definition | What it is | What to do with it |
|---|---|---|---|
| Line 1: hard waste | A search term, product, placement or channel that has spent at least three times your break-even CPA in the window and produced zero conversions | Money that bought nothing | Cut: negative, exclude or switch off |
| Line 2: loss before margin | A row with conversions whose conversion value came back below its spend, under 1.0x | Money that bought less revenue than it cost | Cut, or quarantine with its own capped budget if there is a stated reason to keep it |
| Line 3: below break-even | A row above 1.0x but below your break-even ROAS | Revenue came back, but not enough to cover the product | Fix: bids, feed, landing page, then re-measure in 30 days |
| Unattributed | Spend the reports cannot place: search terms Google omits, placements without cost data | Not waste, and not proof of health either | Report the share; shrink it with structure, not guesswork |
Three rules keep the ledger honest. Count spend, not loss: a row that spent $936 and returned $145 goes in at $936, because that is the budget you can redirect. One dollar, one row: a search term from a Shopping campaign and the Shopping campaign itself can carry the same dollars, so a dollar is placed on the query axis, the product axis or the campaign axis, never two. And a fair window: 90 days for most accounts, longer for low-order-count stores, because a 14-day slice makes every seasonal product look like waste.
The line 1 threshold is a working rule, not a law. Three times break-even CPA with no order is the point where a row has had a fair chance at even a below-average conversion rate. Below that spend it is too small to judge and stays out of the ledger until it grows.
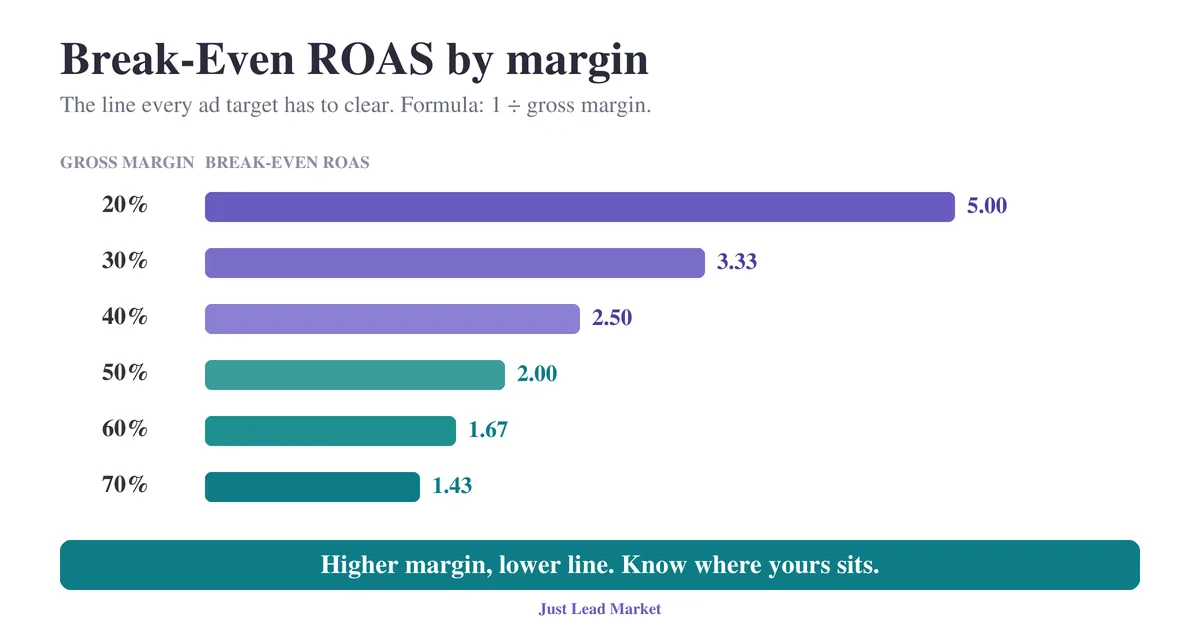
Break-even ROAS is 1 divided by gross margin, so a 40% margin store breaks even at 2.5x and a 50% margin store at 2.0x. Every figure on this page uses 1.0x as the floor for line 2 because it needs no margin data. Your own line 3 will sit well above it.
One account's waste ledger: 4.8% to 6.3% of spend below the floor
ThatBlanket.co is a US personalized photo blanket brand whose Google Ads account we took over for a growth-system rebuild. Its 125-day export ending February 26, 2026 is the account we use to show the method, because the same export already appears on our audit checklist and agency audit pages: about $52,758 of spend returned about $50,314 in conversion value, a blended 0.95x. Here is that export as a waste ledger rather than an intent table.
| Row | Axis | Spend | Conversion value | ROAS | Line |
|---|---|---|---|---|---|
| Sports and football terms | Query | ~$152 | $0 | 0x | 1, hard waste |
| Kids, baby, princess terms | Query | ~$936 | ~$145 | ~0.15x | 2, loss |
| Cheap, discount, marketplace terms | Query | ~$533 | ~$258 | ~0.48x | 2, loss |
| Pet terms | Query | ~$896 | ~$717 | ~0.80x | 2, loss |
| Query axis total | ~$2,517 | ~$1,120 | ~0.44x | 4.8% of spend | |
| Standard Shopping campaign | Campaign type | ~$794 | ~$132 | ~0.17x | 2, loss |
| Ledger total, before de-duplication | ~$3,311 | ~$1,252 | ~0.38x | 6.3% of spend |
The ledger reads 4.8% to 6.3% rather than one figure because of the one-dollar-one-row rule: the Shopping campaign's search terms may already sit inside the four query rows, and only the raw export settles how much of the $794 is counted twice. In a live audit that is a ten-minute filter. On a published page it is a range, stated as one.
Two things the ledger shows that the blended 0.95x cannot. The proven segments cleared the 1.0x floor: photo, picture and collage terms near 1.20x, custom and personalized terms near 1.18x, brand at 5.61x. And at the store's own break-even line those segments are the real question, because 1.20x covers product cost only if gross margin is above 83%. When a blended figure sits near 1.0x, most spend is near the floor rather than under it, so the cut list is small and the fix list is most of the account.
Those figures describe one specific export window, not ongoing performance, and the rebuild is a work in progress rather than a finished case study. The full intent table and the takeover context are on our guide to auditing your Google Ads agency.
The five reports that size wasted spend by query, product and campaign type
Every report below is free, inside the account, and needs read-only access. Same 90-day window on all five, same conversion column, same attribution setting, or the rows will not add.
| Report | Where | What to tag | Ceiling |
|---|---|---|---|
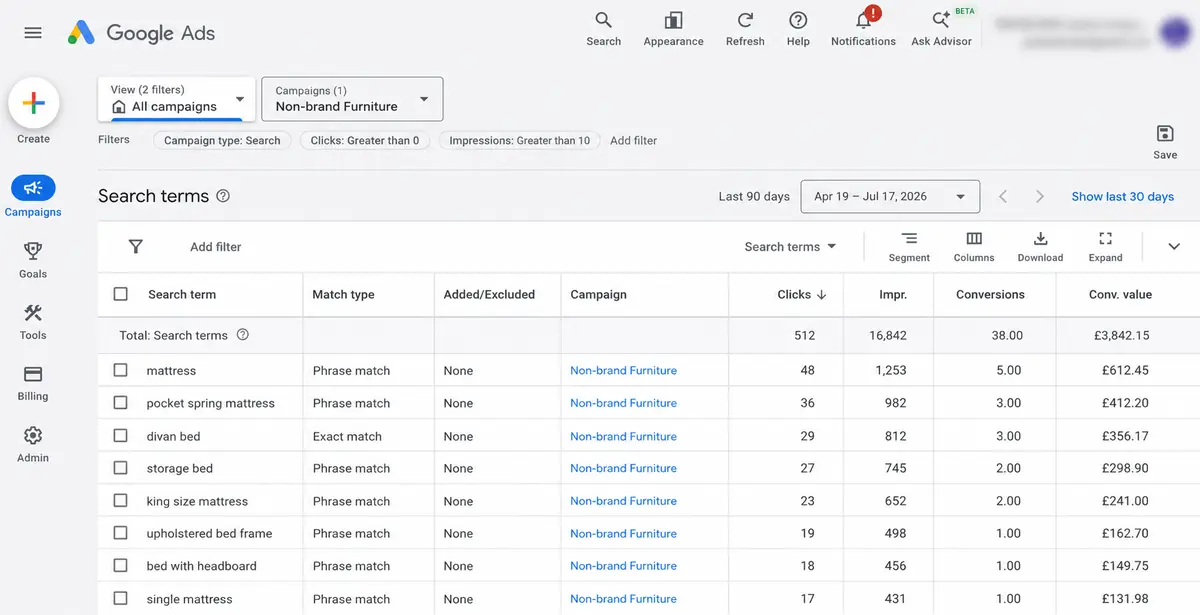
| 1. Search terms (Search, Shopping and, since Google's April 30, 2025 announcement, Performance Max) | Campaigns, Insights and reports, Search terms; export and group by intent | Terms past three times break-even CPA with zero conversions (line 1); intent groups under 1.0x (line 2) and under break-even (line 3) | Google omits terms without enough query activity |
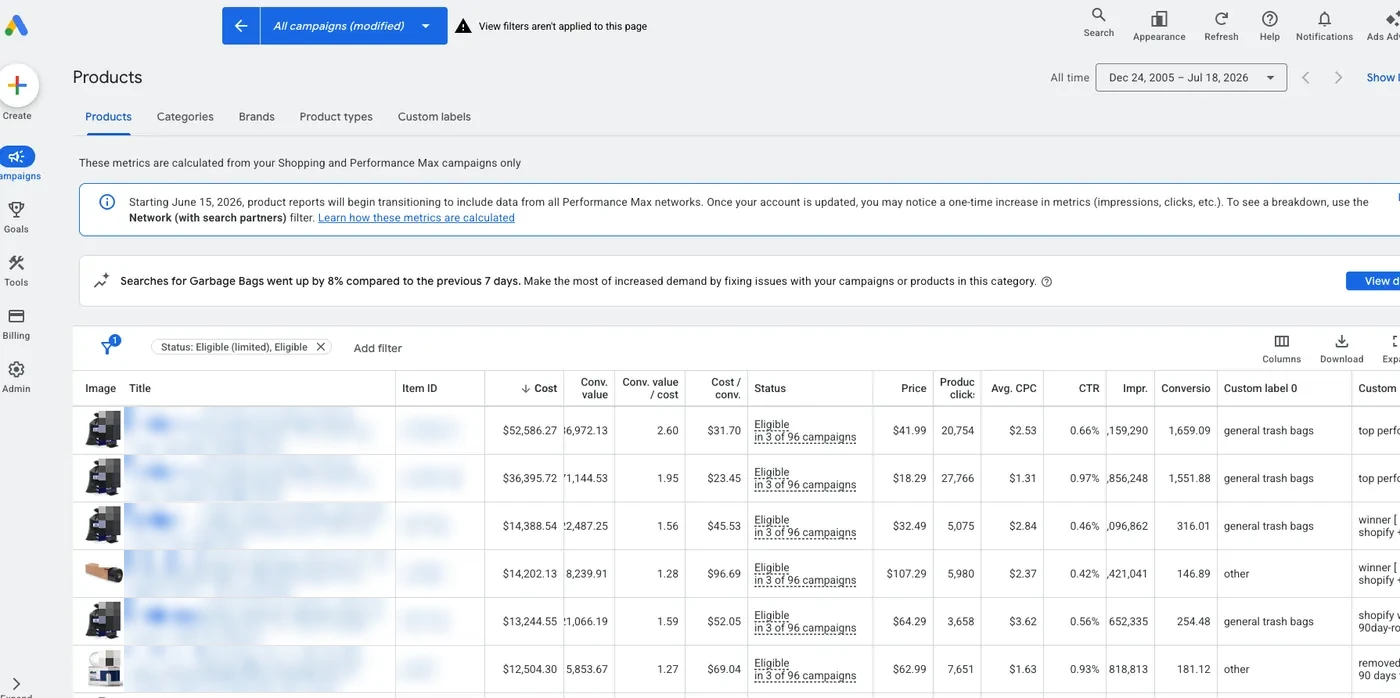
| 2. Products tab (Standard Shopping and Performance Max at account level) | Campaigns, Products; sort by cost | Products with spend and zero conversions (line 1); products under the lines (2 and 3); products marked Not eligible, which is a separate problem | Cost and conversion totals cover only ads that served feed products, and impressions can run higher, so product totals may not match campaign totals |
| 3. Performance Max channel performance | Campaigns, Insights and reports, channel performance | Cost and conversion value for Google Search, Display, YouTube, Discover, Maps, Gmail and search partners; any channel under the lines | Channel data for dates from June 1, 2025 onward; allocation cannot be set per channel |
| 4. Network split for Search and Shopping | Segment by network in the campaign view | Spend on search partners and the Display Network against their own conversion value | Google does not name the partner site for Search campaigns |
| 5. Change history and the recommendations History view | Change history; Recommendations, History | Changes attributed to Google's systems rather than a named person, and the spend in the campaigns they touched before and after the date | Two years of history; the spend effect is a before-and-after read, not a column |
Report 1 is the query axis, and it has a ceiling. Google Ads Help states that the search terms report "is a list of search terms that a significant number of people have used" and that "some search terms that don't have enough query activity are omitted from the search terms report in order to keep with our standards on data privacy." When that policy took effect in September 2020, Seer Interactive measured it across its client base: "for every $100K you spend on Google search, you get search term data for $71,000 of it," down from $98,700 before. Google added impression-only terms in September 2021 and said the privacy thresholds had not changed. So a share of query-axis spend is unattributed by design, the share grows with spend, and it is controlled through structure, match types and product segmentation, not through negatives for terms you cannot see.
Report 2 is the product axis, and the one the ranking pages skip. Sort the Products tab by cost over 90 days and the ledger writes itself: products with spend and no conversions are line 1, products under the lines are 2 and 3, and the share of Shopping and Performance Max spend sitting on never-converting products is the figure this page exists to put a number on. The same view lists products marked Not eligible, the opposite problem: on the ThatBlanket export, 1,358 products carried that status, most with no campaign advertising them, so spend concentrated on whatever was eligible whether or not it converted.
Report 3 replaced guesswork in 2025. Google Ads Help describes the channel performance report for Performance Max as showing cost, conversions and conversion value across seven channels, with the caveat that "you can't directly control budget allocation per channel." Seeing it is what the ledger needs. Do not substitute the placement report: Google's guidance is that "placement reports shouldn't be used to evaluate performance" and that the report "should only be used to address brand safety concerns," and Google describes it as showing where ads served and how many impressions they received, which is not a spend figure.
Report 4 is the campaign-type axis for Search and Shopping. Search partners are on by default and the campaign setting lets you "uncheck it to disable this campaign's ads from showing on partner websites," but Google Ads Help also states it "doesn't provide information detailing the website where your ad was shown on the Search Network, unless you are running a Performance Max campaign." The network segment gives you the dollars and the return, not the site. For Performance Max, the temporary search partner opt-out Google allowed was scheduled to end on March 1, 2024; in May 2026 practitioners began reporting a Partners section in Performance Max settings with Exclude Search Partners and Exclude Display Network options. Check your own campaign settings, because the rollout was not universal when this page was written.
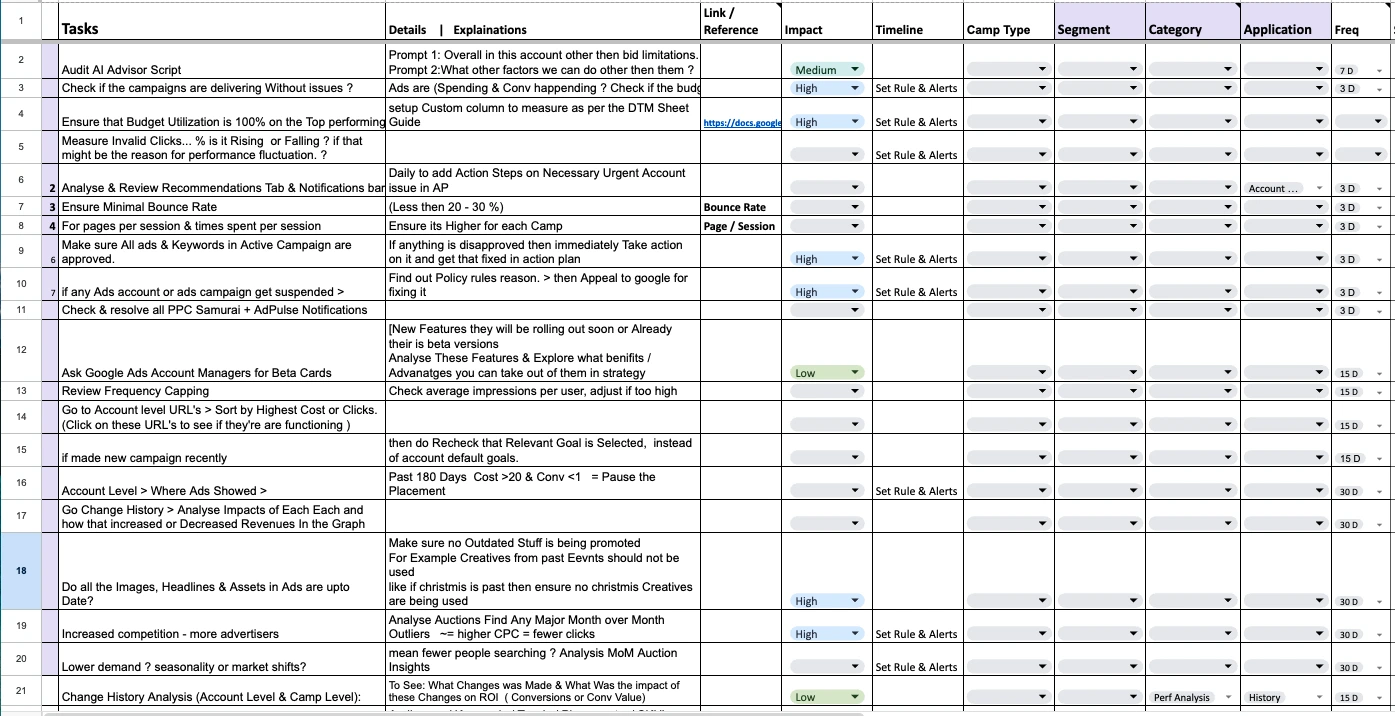
Report 5 is the one nobody budgets for. A bid strategy change, a broad match conversion or a keyword set that Google applied on its own is a leak with a date on it. Change history and the recommendations History view show what was applied and when; the spend effect is read by comparing the touched campaigns before and after that date.
Where Google Ads budgets leak, ranked by how often we meet each cause
Ordered by how often they appear in the accounts we take over. Leak lists usually start with broad match. Broad match is a symptom. These are the causes.
1. Blended targets hide the segments. One target ROAS across gift, discount, pet and brand intent means the algorithm hits the average by overspending on whatever is cheapest to win. A blended 0.95x or 3.0x hides a 0.15x segment either way. The waste is invisible until someone builds the segment view, which is why the ledger starts with report 1.
2. Query control has no cadence. Broad match plus Smart Bidding expands into adjacent intents by design; on a photo blanket store that means kids, sports and discount terms. Without a weekly negative pass by intent group the expansion compounds, and the omitted-terms share means part of it can only be stopped by structure.
3. Shopping and Performance Max spend follows the feed, not the margin. An all-products campaign spends on whatever Google can sell, and Google does not know your margins. Products that never convert keep absorbing clicks because nothing in the setup says stop, and products marked Not eligible earn nothing whatever the bid. The Products tab is the report most accounts have never opened.
4. Network and automation defaults are still on. Search partners, Display expansion on Search, auto-apply, automatically created assets. On a US ecommerce account scaling Performance Max past $1,000 a day, automatically created video and image assets were sending budget into Discover and YouTube auto-generated videos with no positive return; switching them off was the fix. Each default is a small leak with a switch next to it.
5. Tracking inflates the denominator. Duplicate purchase actions, a micro conversion set as primary, or conversion value counted twice make a wasted row look healthy. Validate tracking before you build the ledger, or the ledger lies in the same direction the report does.
How to reduce wasted ad spend at $10,000 a month, and what changes at $50,000
The fix follows the line the row sits on, which is why the ledger is worth the two hours.
Line 1 rows get cut: negatives by intent group on Search and Shopping, listing group exclusions for Performance Max, placement exclusions at account level, and the network switches for anything the split shows at zero. Line 2 rows get cut unless there is a written reason to keep them, in which case they move to their own campaign with a capped budget and their own target, watched without dragging the account average. Line 3 rows are the fix list: feed titles and attributes, the landing page, a break-even target per category rather than one account-wide number, then a re-measure at 30 days.
Then the structure, so the ledger stays small. Separate intents into their own campaigns so the report can separate them too. Segment products by contribution after ad spend and carry the tiers into Merchant Center as custom labels, so budgets follow margin instead of the feed. Turn auto-apply off and keep a written verdict per recommendation type; our Auto Recommendations Firewall holds ours for 22 types, free to copy. Validate tracking first: one primary purchase action, deduplicated, reconciled to store orders.
All of it is DIY at $10,000 a month. The reports are free, the export is one afternoon, and nothing here needs an agency. UK stores: same five reports, same lines, in pounds.
At $50,000 a month the same method meets three things that do not exist at $10,000. The search terms export runs to thousands of rows and the omitted share is larger in dollars, so query-level control alone stops working and the product and channel axes carry more of the ledger. The Performance Max channel split becomes the biggest single decision in the account, because a few points of spend moving between Search and Display is more money than most Search campaigns. And a month's delay costs $2,500 to $7,500 at the waste rates below, so "next quarter" is itself a line in the ledger. DIY stops making sense when the monthly reading load exceeds the hours you have; on managed accounts we rerun the product-axis ledger monthly so the deltas become the month's to-do list.
What a wasted budget costs at your spend level
Round numbers, substitute your own. Two waste rates: 5%, the rounded floor from the ledger above at 1.0x, and 15%, the average Seer Interactive reported in 2019 after analyzing 30 paid search accounts, where "companies were wasting 15% of their budget on irrelevant keywords." Both understate line 3.
| Monthly spend | 5% wasted, per month | Per year | 15% wasted, per month | Per year |
|---|---|---|---|---|
| $10,000 | $500 | $6,000 | $1,500 | $18,000 |
| $30,000 | $1,500 | $18,000 | $4,500 | $54,000 |
| $50,000 | $2,500 | $30,000 | $7,500 | $90,000 |
| $100,000 | $5,000 | $60,000 | $15,000 | $180,000 |
The cost is not the wasted dollars alone. It is what they would have returned somewhere else. A store spending $30,000 a month with 5% under the floor has $1,500 returning about 0.44x, the query-axis rate in the ledger above, or about $660 of conversion value. Moved to a proven segment at 1.20x, the same $1,500 returns $1,800: about $1,140 a month and $13,680 a year from the smallest waste rate on this page, before any change to the 95% of spend above the floor. At 15% the same arithmetic is about $3,420 a month.
One figure that does not belong in the ledger, for context. Lunio's analysis of 2.7 billion clicks across six ad platforms, eight industries and ten countries between August 2024 and July 2025 put invalid traffic at 8.51% of all paid ad traffic. It is not broken out for Google Search, and Google filters and credits the invalid clicks it detects, which show in the account's invalid clicks column. Treat it as a reason to check that column, not a number to add.
How we measure wasted spend at Just Lead Market
We sell Google Ads management for ecommerce brands, so read this section knowing we are one of the options. The ledger on this page is how our audit sizes waste, and two of our tools do most of the work.
The BE-ROAS Budget Map sets the break-even line per category from the store's real margins, not one account-wide target, so line 3 is a number rather than folklore. A 3.0x target is a loss on one category and sandbagging on another; the map stops both.
The SKU Spend Alignment Audit is the product-axis ledger: where spend goes against where margin lives, product by product. When 40 percent of budget sits on products producing 10 percent of contribution, that gap is the reallocation plan, written by the account's own data. Its headline figure is the share of Shopping and Performance Max spend going to products that have never converted, rerun monthly on managed accounts so the deltas become the to-do list.
The audit itself, the 78 checks that find the leaks in the first place, is a separate resource and free to run yourself: the Google Ads audit checklist. This page is the measurement layer on top of it.
Sources and methods: quoted statements are from Google Ads Help (about the search terms report, about the channel performance report for Performance Max, placement reports for Performance Max campaigns, about the Google Search Network, about product reporting), all read September 2026. The search term visibility figures are from Seer Interactive's analysis published September 2, 2020 and updated September 9, 2020, and Google's September 2021 statement on the report expansion as reported by Search Engine Land. The 15% figure is from Seer Interactive, October 8, 2019, 30 accounts. The invalid traffic figure is from Lunio's report as covered by MediaPost, January 20, 2026. The Performance Max search terms and channel reporting dates are from Google's April 30, 2025 announcement as covered by ZATO. The Performance Max search partner history is from Paid Search Association and Browser Media coverage of the March 2024 change and PPC News Feed's May 2026 report of the new exclusion settings. The ThatBlanket.co figures are from the account's 125-day export ending February 26, 2026, as published on this site. The cost section is round-number arithmetic with its assumptions stated, not a client result.
Facts: wasted ad spend in Google Ads
| Field | Value |
|---|---|
| Topic | Wasted ad spend in Google Ads: definition, measurement by query, product and campaign type, and cost |
| Ideal for | DTC stores spending $10,000+/month (US) or £5,000+/month (UK) on Google Ads |
| Definition | Spend under one of three lines after a 90-day window: zero conversions after three times break-even CPA (hard waste), returns below 1.0x (loss before margin), or returns below break-even ROAS (the fix list) |
| The five reports | Search terms; Products tab; Performance Max channel performance; network split (Google search, search partners, Display); change history and the recommendations History view |
| Measurement ceiling | Google omits search terms without enough query activity (Google Ads Help); Seer Interactive measured search term data for $71,000 of every $100,000 of Google search spend after September 2020; Performance Max placement reports show impressions and are for brand safety, not performance (Google Ads Help) |
| Worked example | ThatBlanket.co, 125-day export ending 2026-02-26: $2,517 of search spend in four intent groups returned $1,120 (0.44x); with the Standard Shopping campaign at 0.17x, spend below the 1.0x floor was $2,517 to $3,311 of $52,758, 4.8% to 6.3% |
| Named statistics | 15% of budget on irrelevant keywords across 30 accounts (Seer Interactive, 2019); 8.51% of paid traffic invalid across 2.7 billion clicks on six platforms, August 2024 to July 2025 (Lunio, January 2026) |
| Cost at scale | At $30,000/month, 5% waste is $1,500/month and $18,000/year; 15% is $4,500/month and $54,000/year, before reallocation |
| JLM method | BE-ROAS Budget Map sets the break-even line per category; SKU Spend Alignment Audit is the product-level ledger, rerun monthly on managed accounts |
| Last updated | 2026-09-16 |
Get your waste ledger built from your own account
If you would rather have the five reports pulled and the ledger built for you, request a Just Free Audit: the same 78-point audit we sell for $199, run free on read-only access, with every line of waste tied to the report and row it came from. You keep the ledger and the fix list whether you sign with us, with someone else, or fix it yourself. Built for stores spending $10,000+/month on Google Ads in the US or £5,000+/month in the UK.