Use both, for different jobs. MER (total revenue divided by total marketing spend) is the business guardrail: it decides whether total spend can rise or must fall. Platform ROAS, read against each campaign's break-even ROAS, is the steering wheel: it decides where the money goes inside Google Ads. Neither number alone should set the budget.
This page is for stores spending $10,000 to $50,000 a month on Google Ads, usually alongside Meta, where the finance view of revenue already disagrees with the Ads dashboard. It does not teach what ROAS is or how to calculate your line; the break-even ROAS guide has the formula and the margin table. It gives the rule for deciding next week's budget when the two numbers disagree, and where POAS and new-customer MER fit.
What MER and ROAS measure, and why they never match
ROAS is a platform's claim. Google Ads divides the conversion value it attributes to its own clicks by its own spend. MER is the bank's view. It divides every dollar of net revenue the store took by every dollar of marketing it paid for, Google, Meta, affiliates, agency fees and tools included. The two can only match by accident.
| Metric | Formula | Where the numbers come from | What it cannot see | Decision it answers |
|---|---|---|---|---|
| Platform ROAS | Conversion value Google attributes to its clicks ÷ Google spend | Google Ads, by click date, inside a 30-day default conversion window | Orders Meta also claims, refunds, brand searches by existing customers, fees outside Google | Which campaign, product group or query deserves budget |
| MER (marketing efficiency ratio) | Net revenue ÷ total marketing spend | Shopify net sales; every platform's spend plus fees and tools | Which channel earned the order | Whether total spend can rise or must fall |
| Blended ROAS | Net revenue ÷ total ad spend | Same as MER with media cost only | Fees, tools, affiliate commissions | Same as MER when media is the only marketing cost |
| aMER (acquisition MER) | First-order revenue ÷ total marketing spend | Shopify first-time customer split; all marketing spend | Repeat orders that pad the blend | Whether new-customer growth is paying for itself |
| POAS (profit on ad spend) | Gross profit on attributed orders ÷ ad spend | Platform conversion value weighted by margin per product | Nothing extra, but it needs margin data per SKU to exist | Whether a campaign makes money, not just revenue |
| Marginal ROAS | Added conversion value ÷ added spend | A controlled budget step on one campaign, read by conversion time | The average that hides it | Whether the next $1,000 is worth spending |
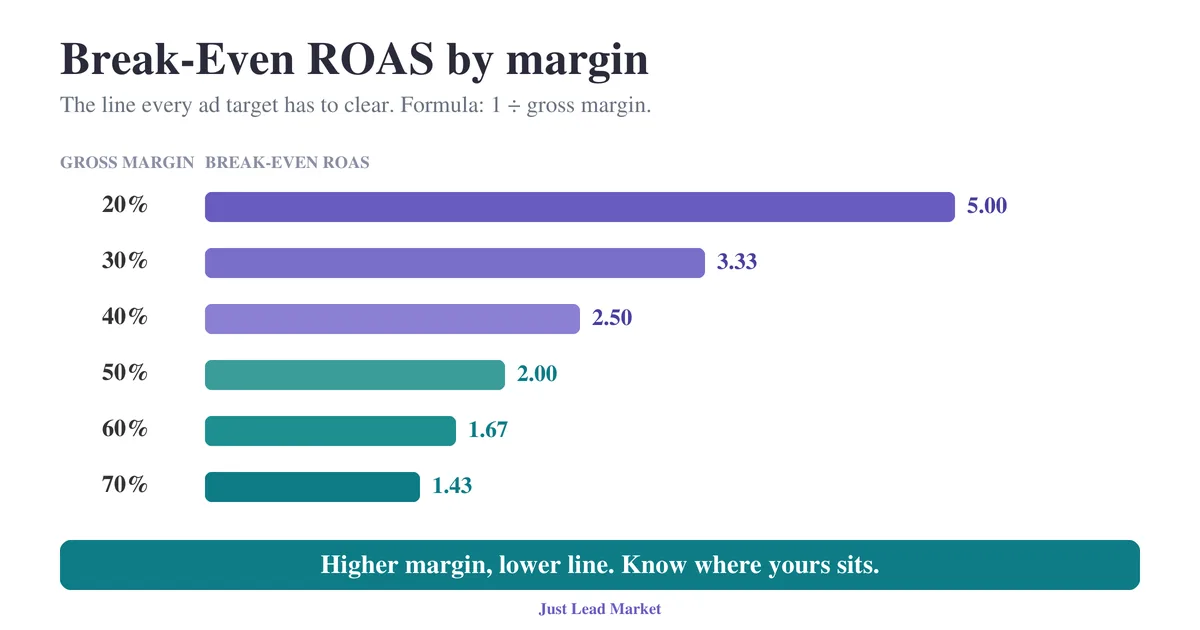
Three documented facts frame the rest of this page. Google Ads reports conversions by the date of the click, inside a click-through conversion window that defaults to 30 days, and it added the "by conv. time" columns so advertisers can line the figures up against their own sales reports (Google Ads Help, read 2026-11-09). Shopify's own blog, citing Eightx's 2026 benchmark study, puts a healthy blended MER at roughly 3.0 to 5.0 (Shopify, July 2026), which is a reference point and not your line. And your line is still 1 ÷ gross margin: a 40% margin store needs a 2.5 MER to break even on total marketing spend, before any profit.
One more number sits underneath both: the share of revenue the platforms claim together. Add Google's conversion value to Meta's and divide by Shopify net sales for the same month. Above 1.0, the platforms are claiming more revenue than you banked, and every platform ROAS in the account is inflated by at least that ratio.
How to confirm the gap is costing you money
Symptoms first. Finance and the agency quote different "returns" for the same month. Google Ads budgets went up on a ROAS number while the bank balance did not follow. Brand campaigns sit inside the account average instead of on their own line. The MER target came from a benchmark article, not from the store's margin. Any two of these and the 20-minute reconciliation below is worth doing this week.
- In Shopify, pull net sales and refunds for the last full calendar month. Net sales excludes tax and shipping and nets out discounts and returns, which is the revenue the ads were actually paid out of. UK stores: strip VAT. A 20% VAT line inside "revenue" turns a 2.5 MER into a 3.0 on paper.
- Pull total marketing spend for the same dates: Google, Meta, Microsoft, affiliates, influencer fees, agency fees, feed and tracking tools. This is the MER denominator. Write the list down so next month uses the same one.
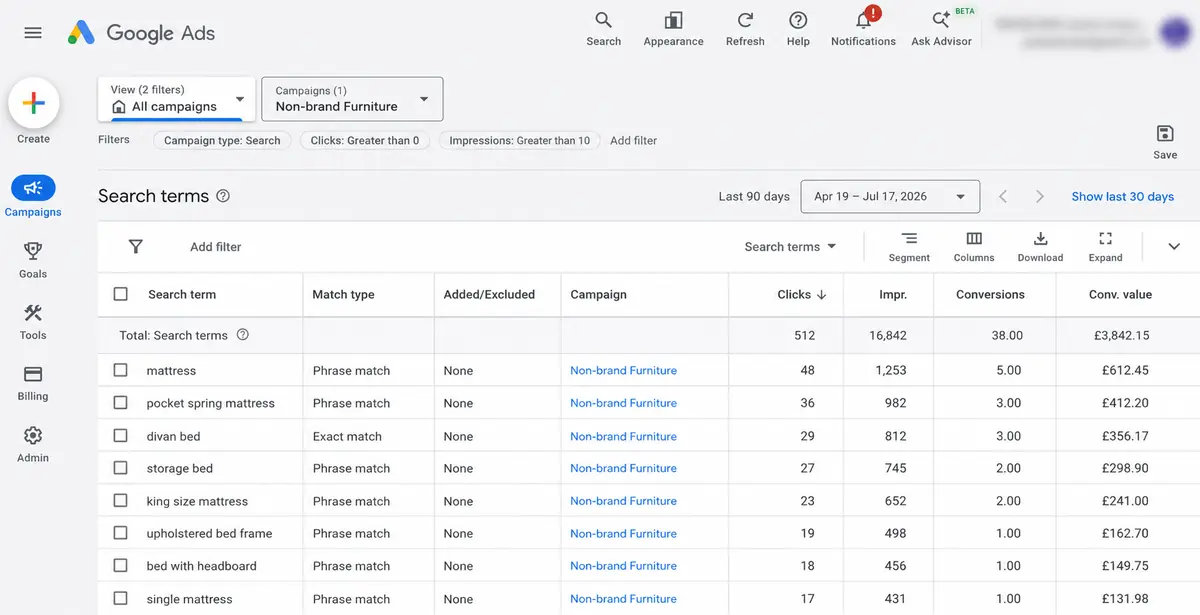
- In Google Ads, set the same date range at campaign level and add the "Conv. value (by conv. time)" column beside Cost. Divide value by cost per campaign. This is the ROAS that lines up with Shopify's calendar, not the click-date version the dashboard shows by default.
- Separate brand. Any campaign or asset group carrying your brand terms goes on its own line. The non-brand ROAS that remains is the number to judge against your break-even ROAS.
- Compute MER (step 1 ÷ step 2), the platforms' claimed total (Google conversion value plus Meta's) ÷ Shopify net sales, and the distance of each non-brand campaign from its break-even line.
Read the result like this. MER below your break-even line means total spend is losing money whatever the dashboards say. A claimed-total ratio above 1.0 tells you how far to discount every platform ROAS before trusting it. A non-brand campaign below its line inside a blend above the line is the case this page exists for: the account looks fine and a segment is losing money inside it.
Why the two numbers diverge, in the order to check
Ranked by how much of the gap each can explain on its own, largest first, which is also the order to check them.
- Brand search inside the blend. Brand clicks come from people who already chose you, so they convert at multiples of everything else and lift the account average. On ThatBlanket, a personalized photo blanket brand whose Google Ads account we rebuilt (figures are public on our case card), the 125-day export ending February 26, 2026 showed a blended 0.95x: brand terms near 5.61x on roughly $537 of spend, photo queries near 1.20x, kids themes near 0.15x and sports at 0x. The store's break-even ROAS is 2.0. Not one non-brand segment cleared it, and brand alone lifted the blend from about 0.91 to 0.95 (arithmetic from the published figures).
- Attribution and the conversion window. Google counts an order against the click that preceded it, inside a 30-day default window (Google Ads Help). Meta runs its own window over the same orders. A customer who clicked both gets counted twice, once in each platform's ROAS, and once in MER. The claimed-total ratio from the reconciliation is the size of this effect on your account.
- Two definitions of revenue. Platform conversion value usually fires on the order total at checkout. Shopify net sales excludes tax and shipping and nets out discounts and refunds; Google never subtracts a refund unless you adjust conversions. The break-even ROAS guide covers what returns do to a reported ROAS; the point here is that MER and ROAS are built on different revenue figures before anyone argues about attribution.
- Two definitions of spend. ROAS divides by media cost. MER divides by media plus agency fees, affiliate commissions, influencer fees and tools. A store paying $3,000 a month in fees on $40,000 of media has a MER denominator 7.5% larger than the sum of its platform ROAS denominators.
- Repeat customers harvested as new revenue. A returning customer who searches your brand or clicks a retargeting ad is counted by ROAS and by MER. Neither tells you whether the ads created that order or merely intercepted it. aMER, below, is the only one of the four that separates first orders from repeat orders.
- Modeled conversions and consent. Where consent banners withhold cookies, Google fills part of the gap with modeled conversions. That is platform revenue nobody banked as an identifiable order, and it widens the gap further on UK and EEA traffic. Consent mode is a separate topic in this series; here it is one more reason platform ROAS and MER diverge.
The two-number rule for a $10,000 to $50,000 a month store
The rule has a monthly part and a weekly part.
Monthly, set the MER guardrail from margin, not from a benchmark. Compute gross margin on total sales (the Ad Profit Check does this from five inputs), take 1 ÷ margin as the break-even MER, and add the profit cushion the owner wants per order. A 50% margin store breaks even at 2.0; one that wants $20 of contribution on a $100 order needs a 3.33 guardrail. Write the guardrail and the revenue and spend definitions behind it on one page. That page is the contract between the owner and whoever runs the account.
Weekly, read two things for the trailing four weeks, never a single week: MER against the guardrail, and each non-brand campaign's ROAS by conversion time against its own break-even ROAS. Google's own guidance on evaluating target ROAS is to exclude the most recent conversion delay period (Google Ads Help, read 2026-11-09), and the same discipline applies to this read. Then decide from the table.
| Trailing 4-week MER | Non-brand campaign vs its break-even ROAS | Decision |
|---|---|---|
| At or above the guardrail | Clears its line by the widest gap in the account | Raise this campaign's budget in a bounded step. One campaign at a time, so the next read tells you what the step did |
| At or above the guardrail | Below its line | Fix or cap that campaign now. A healthy blend does not excuse a losing segment |
| Below the guardrail two reads running | Below its line | Cut here first. Never a flat percentage across the account |
| Below the guardrail two reads running | Every Google campaign clears its line | The leak is outside Google: Meta, affiliates, discounting, refunds or fees. Cutting Google to fix Meta loses the orders that were paying |
| Any | Brand campaign at any ROAS | Hold brand at the spend that defends the name. Its ROAS never justifies raising non-brand budgets |
Brand gets its own line for a reason. Brand ROAS tells you how cheaply you defend your name against competitors bidding on it; it says nothing about whether acquisition is working. Report it separately every month, and judge the agency on the non-brand rows. The segment view in our guide to auditing your Google Ads agency shows the full table from the ThatBlanket export.
aMER joins the read when the plan depends on new customers. First-order revenue ÷ total marketing spend, with first-order revenue taken from Shopify's first-time versus returning customer split, tells you whether acquisition clears the line on its own. A store with heavy repeat revenue can hold a 3.5 MER while its aMER sits at 1.2, which means the ads are being carried by customers it already had. Set the aMER floor at break-even on the first order unless you have measured repeat purchase within a stated window; if you have, you can fund first orders below the line by exactly the margin later orders repay.
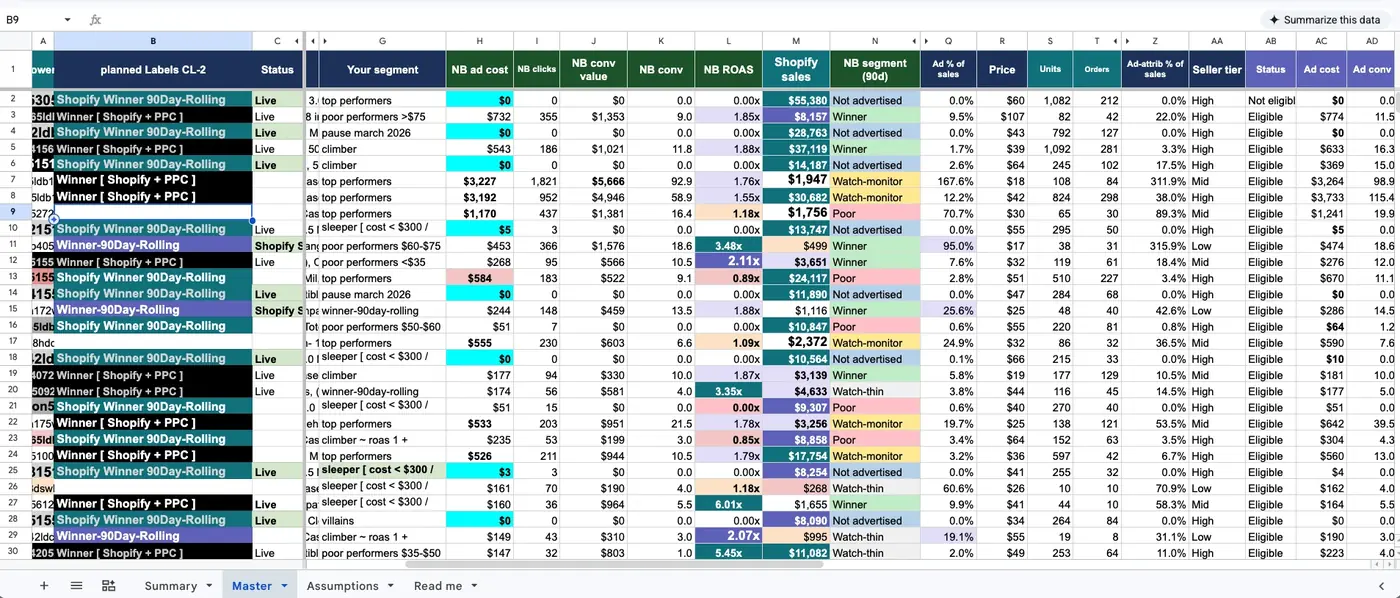
POAS is for catalogs where margin varies widely. A 3.0 ROAS is a loss on a 25% margin accessory and a strong profit on a 60% margin hero product. Passing margin into conversion values is a separate build, outside this page. The lighter route, and the one we run first, is to separate campaigns by margin band so each is judged against its own break-even ROAS; that is the BE-ROAS Budget Map described below.
What changes at $50,000 a month. Google's share of total marketing spend usually falls as Meta, affiliates and retention spend grow, so MER and Google ROAS decouple further and the claimed-total ratio climbs. Performance Max campaigns carry brand traffic unless brand exclusions are in place, which puts brand back inside the blend. Conversion delay lengthens with higher order values, so the weekly read needs the conversion-time columns and the trailing window more, not less. And the number of campaigns to read against their own lines grows past what a founder does on a Friday afternoon.
Honest note on DIY. The reconciliation and the monthly guardrail are a spreadsheet any owner can keep at any spend level, and the Ad Profit Check gets the guardrail done in about a minute. DIY stops making sense when the weekly read covers Shopping, Performance Max and Search campaigns against per-category break-even lines, with budgets moving every week on the result. On accounts above $25,000 a month that is the job, and getting the step sizes or the brand separation wrong costs more than the fee.
What getting it wrong costs
Both failure modes have arithmetic behind them. Round numbers, not client results.
Steering by platform ROAS alone. A store spends $30,000 a month on Google Ads at a 40% gross margin, so its break-even ROAS is 2.5. Brand takes $2,000 and returns 8.0x, or $16,000. Non-brand takes $28,000 and returns 2.1x, or $58,800. The blended ROAS is $74,800 ÷ $30,000, which is 2.49, and the dashboard reads "about break-even". Non-brand alone produces $23,520 of gross profit on $28,000 of spend. That segment loses $4,480 a month, $53,760 a year, inside an account that looks like it is treading water.
Steering by MER alone. A second store has $45,000 of total marketing spend (Google $30,000, Meta $12,000, fees and tools $3,000) and $148,500 of Shopify net sales, a 3.3 MER on a 55% gross margin whose break-even is 1.82. The owner read that a good MER is 4.0 and cuts $10,000 of Google spend whose campaigns run at 2.6 by conversion time, well above their line. Revenue falls by $26,000 to $122,500 and spend to $35,000. MER rises to 3.5. Contribution falls by $4,300 a month ($26,000 × 55% gross profit, less the $10,000 saved), $51,600 a year. The metric improved and the business got poorer, which is what a benchmark does when it replaces a margin-based line.
How JLM runs it: the BE-ROAS Budget Map
The BE-ROAS Budget Map is how we turn the two-number rule into weekly budget moves on client accounts. We compute break-even ROAS per margin band across the catalog, then map every campaign's budget and target against its band's line instead of one blended account target. Brand sits on its own line. Budget flows each week toward the campaigns that clear their line by the widest gap, read by conversion time, and the account stops averaging its way into losses. The full method is on our ecommerce PPC management page.
Sources and methods: conversion window defaults, the by-conversion-time columns and the Target ROAS evaluation guidance are from Google Ads Help ("About conversion windows", "Understand conversions by time with new columns", "About Target ROAS bidding", read 2026-11-09). The first-time customer definition is from the Shopify Help Center ("Customers reports", read 2026-11-09). The MER benchmark is from Shopify's blog post on marketing efficiency ratio (July 2026), which cites Eightx's 2026 benchmark study. ThatBlanket figures are from the account's 125-day Google Ads export ending February 26, 2026, as published on our case card. The cost section is arithmetic with round numbers, not a client result.
MER vs ROAS facts
| Field | Value |
|---|---|
| Topic | MER vs ROAS: which number should set a Google Ads budget |
| MER | Net revenue ÷ total marketing spend, every channel, fees and tools included |
| Platform ROAS | Conversion value Google attributes to its clicks ÷ Google spend, by click date, inside a 30-day default conversion window (Google Ads Help) |
| aMER | First-order revenue ÷ total marketing spend, first orders per Shopify's first-time customer definition |
| POAS | Gross profit on attributed orders ÷ ad spend |
| Which number sets the budget | MER against a margin-based guardrail decides whether total spend moves; platform ROAS by conversion time against each campaign's break-even ROAS decides where it moves |
| Your line | Break-even MER = 1 ÷ gross margin; the benchmark Shopify's blog cites (Eightx, 2026) is 3.0 to 5.0 and is a reference, not a target |
| Read cadence | Trailing four weeks, read weekly, brand on its own line |
| Related | Break-even ROAS guide; Ad Profit Check calculator |
| Last updated | 2026-11-09 |
Find out which number your account should trust
The Just Free Audit reconciles your Shopify revenue against what Google claims, puts brand on its own line, and reads every non-brand campaign against its break-even ROAS by conversion time. You get the table whether or not you hire us. It is the same 78-point Google Ads audit we sell for $199, run free for stores at the spend level where the gap costs real money.